British First World War Trench Maps, 1915-1918
Introduction

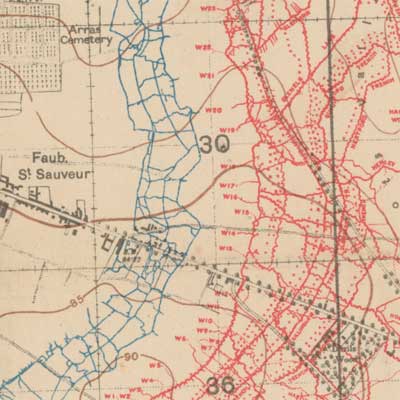
trenches just east of Arras, revised to 4 March 1917
Trench maps are a primary source for studying the major battlefields of the Great War. They show in detail the changing Front Line and its associated communication trenches, as well as the location of enemy positions and defences including artillery gun emplacements, machine guns, mines, wire entanglements, and observation posts. They record the names that soldiers gave the trenches, as well as the names of nearby farms, villages, woods, and other landmarks. These are often referred to in the written histories of the War, including personal war diaries and official regimental accounts. Accurate locations, and the distances and bearings between them were essential for the artillery, and all the maps show the British Trench Map Grid System as a prominent overlay, a unique referencing system often used in associated written records. Trench maps illustrate the innovative survey, compilation, and printing technologies that advanced rapidly during the conflict. Comparing trench maps to each other over time, and to the present day, allows a detailed and fascinating graphic insight into the changing topography of the Western Front.
British First World War Trench Maps home page
In this section
- Source mapping, surveying and printing, depiction of trenches
- Sheet numbering and references, NLS collection, further reading and links
Background
Maps have always been vital tools for military commanders, allowing them to form a picture of the terrain for planning attack and defence, but their value rose to greater prominence than ever during the First World War. It is estimated that over 34 million British maps of the Western Front alone were printed between 1914-18, the vast majority by Ordnance Survey. Whilst every country involved in the conflict had medium scale mapping for reconnaissance purposes and for planning the general movement of armies, the emergence of trench warfare created the need for much more detailed maps. Accurately plotting positions and the angular measurements between them became crucial for planning artillery bombardment, and for firing on hidden targets based on their precise location on the map. Artillery was also vulnerable to long-range rifle and machine-gun fire, and maps also allowed defensive positions to be determined. Accurate spatial positioning using maps became essential for both defensive and offensive operations; as summarised by Major-General N.M. Macleod (who commanded the 4th Field Survey Company from 1916-18, and went on to become Director-General of Ordnance Survey (1935-43), "in the battles of 1918 the gun was king, and the theodolite and plane-table its unadvertised but indispensable ministers ... The real secret of success lay in the action of the artillery, and that not until the gunner co-opted the surveyor to assist him was that secret revealed ... "
Source mapping

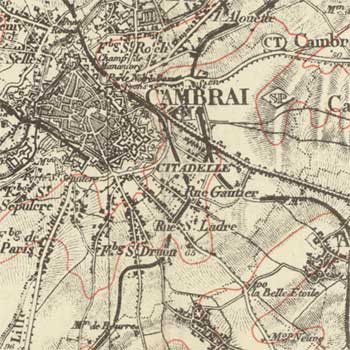
based on earlier French 1:80,000 mapping
When war broke out in 1914 it initially seemed to British military commanders that the Western European theatre of operations was already very well mapped, with leading state and military mapping institutions producing detailed topographic maps. In addition, from 1909-1910 the British War Office had compiled up-to-date military series maps of France at 1:80,000 (GSGS 2526) and Belgium at 1:100,000 (GSGS 2364). But following the initial German Schlieffen Plan to sweep through neutral Belgium and knock-out France in 1914, the German armies were driven back to defensive positions north of the river Aisne by August. As both sides dug in on the Aisne, and the Germans advanced in the north towards Ypres by October 1914, there was a new requirement for much more detailed mapping. The best that could be done in the short-term without a proper survey was to enlarge Belgian and French topographic mapping, but with increasingly dangerous results. The Belgian 1:40,000 series could be enlarged reasonably well to 1:20,000, and the War Office had also obtained Belgian lithographic stones and drawings before the fall of Antwerp to the Germans in October. But outside of the north-eastern frontier regions of France (which were often covered by more accurate ‘Plans Directeurs’), the French 1:80,000 series had to be used, which when enlarged to 1:20,000 was practically useless. Many details had not been fixed using trigonometry and were often hundreds of yards out of position, whilst vertical relief was shown by hachures rather than by more useful contour lines, and with only a scattering of spot heights. The problems were compounded by the use of different spheroids (models representing the shape of the earth) on the Belgian and French series, which resulted in significant differences between their presentation of common points. As if these problems were not enough, both the Belgian and the French series were entirely metric, and when they were overprinted with British Imperial yards, there were always discrepancies at the sheet edges.
Surveying and printing methods
Due to the difficulties of the enlarged French and Belgian mapping, the decision was taken to resurvey much of the area behind the British Front from late 1914 onwards. A rapid plane-table and traverse survey allowed the traditional trigonometric techniques of triangulation to be used, breaking down larger triangles into steadily smaller triangles to confirm the topography more accurately. But the survey work was dangerous, and obviously could not extend into the important forward areas of German occupation. Here the use of aerial photography was particularly vital for much detail of enemy positions - especially for trench mapping, artillery maps, and other large-scale maps. There were major advances in the capture, interpretation, rectification and use of air photos (aerial photogrammetry) during the War. Although captured German maps had their value, the War also encouraged rapid improvements in innovative techniques such as flash-spotting and sound-ranging. Flash-spotting entailed the observation of gun flashes and the direction of counter-fire onto them, assisted by the 'flash and buzzer board' allowing direct telephone communication between Group Headquarters and survey posts for synchronising observations. Flash-spotting located enemy guns by measuring the time intervals for the flash of light or sound to arrive at carefully selected positions. More effective flash spotting and sound ranging were used successfully to locate German guns by time of the Battle of Arras, 1917, and were critically important for the surprise tank attack at Cambrai in November 1917. They enabled 'predicted fire' and successful artillary barrages, accurately determining gun targets based on their surveyed positions, without the traditional more time-consuming prior registration of targets by trial and error.
British field survey and mapping on the Western Front was officially coordinated by Major E.M. Jack, in collaboration with W.C. Hedley at the War Office and Colonel Sir Charles Close at the Ordnance Survey. From October 1914, large-scale maps were printed by the Ordnance Survey at Southampton, with the War Office concentrating on smaller-scale maps, but aspects of production increasingly moved to France and Belgium during the War. Lithography allowed maps to be drawn straight onto the printing stone, or onto transfer paper from which it was laid down onto the stone, and sheets could be printed rapidly by hand. From mid-1916 there were five Field Survey Companies, one for each army with printing in the field using hand-operated lithographic presses. From early 1917 these were upgraded to powered lithographic presses in the field for map printing, whilst by the end of the War, the Americans were printing maps using lorry-mounted rotary lithographic presses. It is estimated that typical print runs were about 6,000-8,000 sheets for an edition, but the numbers varied according to the situation.
Depiction of trenches

in red and German trenches in blue
Trench maps used the standard GSGS topographic series mapping as a backdrop, and overprinted it with other information, including trenches, hostile battery positions, targets, and defences. They were only usually issued at 1:20,000 and larger scales. Until early 1918, German trenches were usually overprinted in red, with British or Allied trenches (where shown) in blue, but thereafter the colours were usually reversed for the remainder of the War with German trenches shown in blue to match the French trench map colour system. Most trench maps only show good detail for the German trenches, perhaps with only a rudimentary indication of the British Front Line, and were the standard maps used in the field. Much smaller numbers of “Secret” editions of trench maps depicting both British and German trenches were issued to reduce the risk of their capture and use by the Germans, although this policy was relaxed by 1918.
trenches were revised to in their upper margin.
It is also possible in the brief selection of trench maps on this website to see both the evolution in form and the rapid advances in accuracy, content and detail over time. The earliest mapping in March 1915 for Neuve Chapelle is remarkably crude, enlarged from 1:80,000 French maps with air photo revision. There are also a set of inverted maps from this time (for example, Aubers Ridge), orientated with south at the top, intended to assist troops and for artillery fire advancing to the south, but these “upside-down” maps were soon considered dangerous and confusing, and not continued. By the summer of 1915, the regular series of 1:10,000 and 1:20,000 including freshly surveyed information extended over a growing area. With the ability to survey contours using rapid plane-table techniques, additional contours were often added to later editions, and there was a steady increase in the range of overprinted trench information over time. There were also smaller-scale maps at 1:40,000 produced such as the Map of the Somme, printed in December 1916, recording the main positions of the British front from July- November 1916. With the German withdrawal to the defensive Hindenburg Line in early 1917, the area left behind was devastated and often appears with villages marked 'In Ruins'. Trench maps show positions for and after major battles, for example, at Messines Ridge in June 1917, where 500 tonnes of explosives laid in 21 mines literally blew the Germans off the ridge resulting in over 10,000 deaths and advancing the British lines further east. They also show the disastrous Battle of Passchendaele / Third Battle of Ypres from July - November 1917 where both sides lost a combined total of over a half million men. Lithography made it easy for printing special combined sheets for particular areas at sheet boundaries, and printing maps of selected parts of sheets (for example, the Moeuvres Special Sheet illustrating the Hindenburg Line just after the Cambrai operation of 20 November 1917). In 1918, the speed of the German Spring Offensives and advances from March-June resulted in the front lines moving more than sixty miles west, whilst the Allied retaliation from the summer onwards drove the Germans rapidly back to the east, but trench maps were still compiled and were of value until the end of the War.
 Next: Page 2 of 2
