OS Six-Inch Woodland in Scotland, 1840s-1880s Map Viewers - Help
Introduction
These map viewers allow woodland on the OS Six-Inch to the mile, 1st edition maps of Scotland to be viewed. Read further information about the woodland layer, or view correction examples.
Overlay viewer
The following sections describe the main tools and functions on the map viewer screens.
Lower left
Top right
Lower right (Overlay viewer only)
Side by Side viewer
In the Side by Side viewer, by default, the Woodland layer and OS Six-Inch (1840s-1880s) maps appear on the left, and the Ancient Woodland Inventory (AWI) layer appears on the right.
Map Layers
There are 17 map layers in the viewers, dating from Roy Military Survey (1752-55) to the present day. The main Ordnance Survey editions of mapping at Six-Inch to the mile are available, as are various thematic layers, including the 1930s Land Utilisation Survey. Modern day layers of satellite imagery, topographic mapping and LiDAR are also available.
Add Layer (lower left)
Add your own layer of information to the map, to view and edit it. Or create your own layer.
If you click/tap on the 'Add Layer' icon ![]() , to the lower left of the screen, then an 'Add your own layer' panel opens:
, to the lower left of the screen, then an 'Add your own layer' panel opens:
- Choose file format: KML, GPX, or GeoJSON
- Choose file source: browse to find a local file, or paste in a URL for an online file
- Click/tap on the IMPORT button to add your layer. The map should centre on your layer's extents.
For layers with attributes, you can click/tap on the layer to bring up a popup box showing the specific attributes. You can edit the layer with the Add or Edit Features tools ![]() (top right). To remove the layer, click/tap on the Remove top layer link in the lower centre of the screen.
(top right). To remove the layer, click/tap on the Remove top layer link in the lower centre of the screen.
Printing and Image Export/Download (lower left)
If you click/tap on the print icon ![]() , to the lower left of the screen, then a print panel opens with various options:
, to the lower left of the screen, then a print panel opens with various options:
- Portrait / landscape orientation
- Page size – A4 to A0
- Margin – 0 to 10 mm
- Scale – 1:500 to 1:1,000,000 - set an exact scale for your map
- North Arrow – off or on
- Scale bar – off or on
At this stage you can also pan/drag or zoom the map image to make sure its covering exactly the right area of interest.
You can then save the image in various formats – JPEG, PNG, PDF, or copy the image to clipboard. It is also possible to print the map directly to a printer.
If you wish to obtain a georeferenced map export, please consult our Re-using georeferenced maps guide.
Go to Woodland Overlay viewer.
Add or Edit Features (top right)

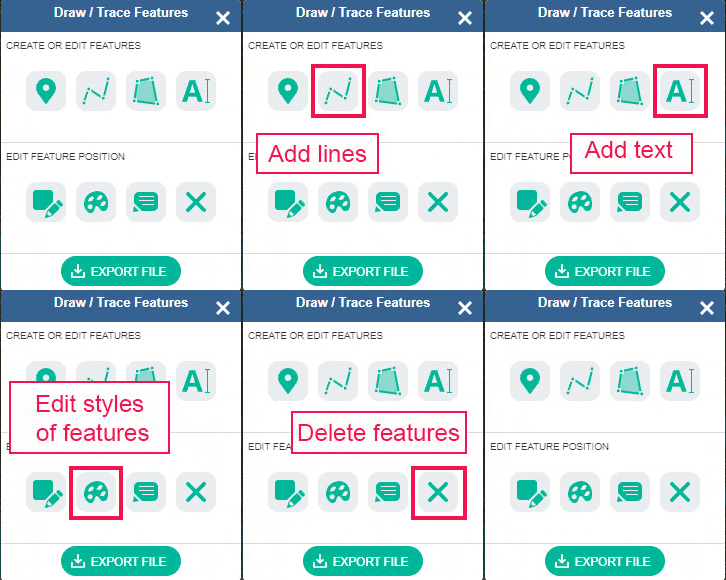
If you select the Draw / Trace Features button ![]() to the upper right, you can draw or trace new features, edit layers, and print or export the results.
to the upper right, you can draw or trace new features, edit layers, and print or export the results.
- You can Create Features, annotating the map, or tracing features. You can add points, lines, polygons or text.
- You can Edit Features, alter feature position, feature style (colour, line and fill properties), or feature text. You can also Delete Features
- You can Print or Save an image of your sketch or tracing at any time using the Print button

- You can Export your drawing as a KML (Keyhole Markup Language), GPX, or GeoJSON file, saving the geographic coordinates, features and styles of your drawing.
- The KML format includes feature style tags natively, so styles (such as line colour and thickness, or polygon fill colours) can be saved and shared more easily. KML files can also be opened in Google Earth.
- For GeoSJON and GPX files, the styles and attributes are recorded in extensions: GeoJSON simplestyle or GPX Exchange Format.
- The default GeoJSON export projection is WGS84 (EPSG:4326) with latitude and longitude coordinates, but you can also export GeoJSON in the British National Grid (EPSG:27700) with Eastings and Northings in metres by choosing the GeoJSON (BNG) option.
When tracing features such as lines or polygons, a double-click finishes the drawing, so to add points close together, zoom in (with the mouse wheel or pinch zoom) to do this. If you accidentally finish drawing too soon, you can edit the feature to add or alter points.
The downloaded files can be brought back into the Georeferenced Maps viewer using the Add Layer button ![]() , for further editing. You can also open them in any text editor, or open and edit them in QGIS or ArcGIS Online. Read our guide on Opening map datasets in QGIS.
, for further editing. You can also open them in any text editor, or open and edit them in QGIS or ArcGIS Online. Read our guide on Opening map datasets in QGIS.
Go to Woodland Overlay viewer.
Measurement tools (top right)

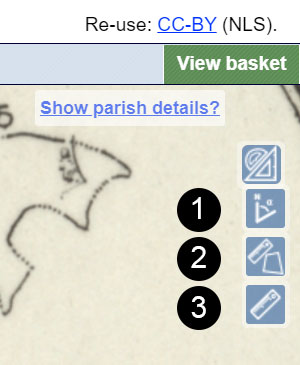
These tools, to the upper right, allow you to measure:
- Bearing or Azimuth - in degrees from true North
- Area - in square kilometres and square miles / square metres and square feet
- Distance - in kilometres and miles / metres and feet
Click or tap on the buttons to toggle the measurement functions on or off. Once selected, click or tap to add points on your route - the current bearing, distance or area is given. Single-click with a mouse or tap to stop and finalise the bearing or distance measurement; double-click with a mouse or double-tap to finalise the area measurement.
Rotation (top right)
Hold the [Alt] and [Shift] keys down, and drag with your cursor, or pinch with two fingers on a touch screen to rotate the map. Click/tap on the blue arrow to the upper right, or refresh the page to return to the default rotation.
Go to Woodland Overlay viewer.
Show height - lower right. (Overlay viewer only)

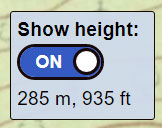
If you switch the 'Show height' button (lower right) to ON, the approximate height of your cursor location is shown in metres and feet. This height data is obtained via the Géoportail Altimetrie Web Map Service, based on elevation information from the N.A.S.A. Shuttle Radar Topography Mission (SRTM3) Global Digital Terrain Model. These heights generally have a horizontal accuracy of 30 x 30 metres.
This height information may give a general idea of heights when looking at maps without surface heights, bench marks, or contours, but it is likely to be less accurate than the heights that are shown on more detailed, larger-scale mapping (eg. at 1:10,000 scale or larger). The height information may be helpful in giving a general idea of the direction of slope and approximate elevation where this information is lacking from the map you are looking at.
Elevation Profile - lower right (Overlay viewer only)
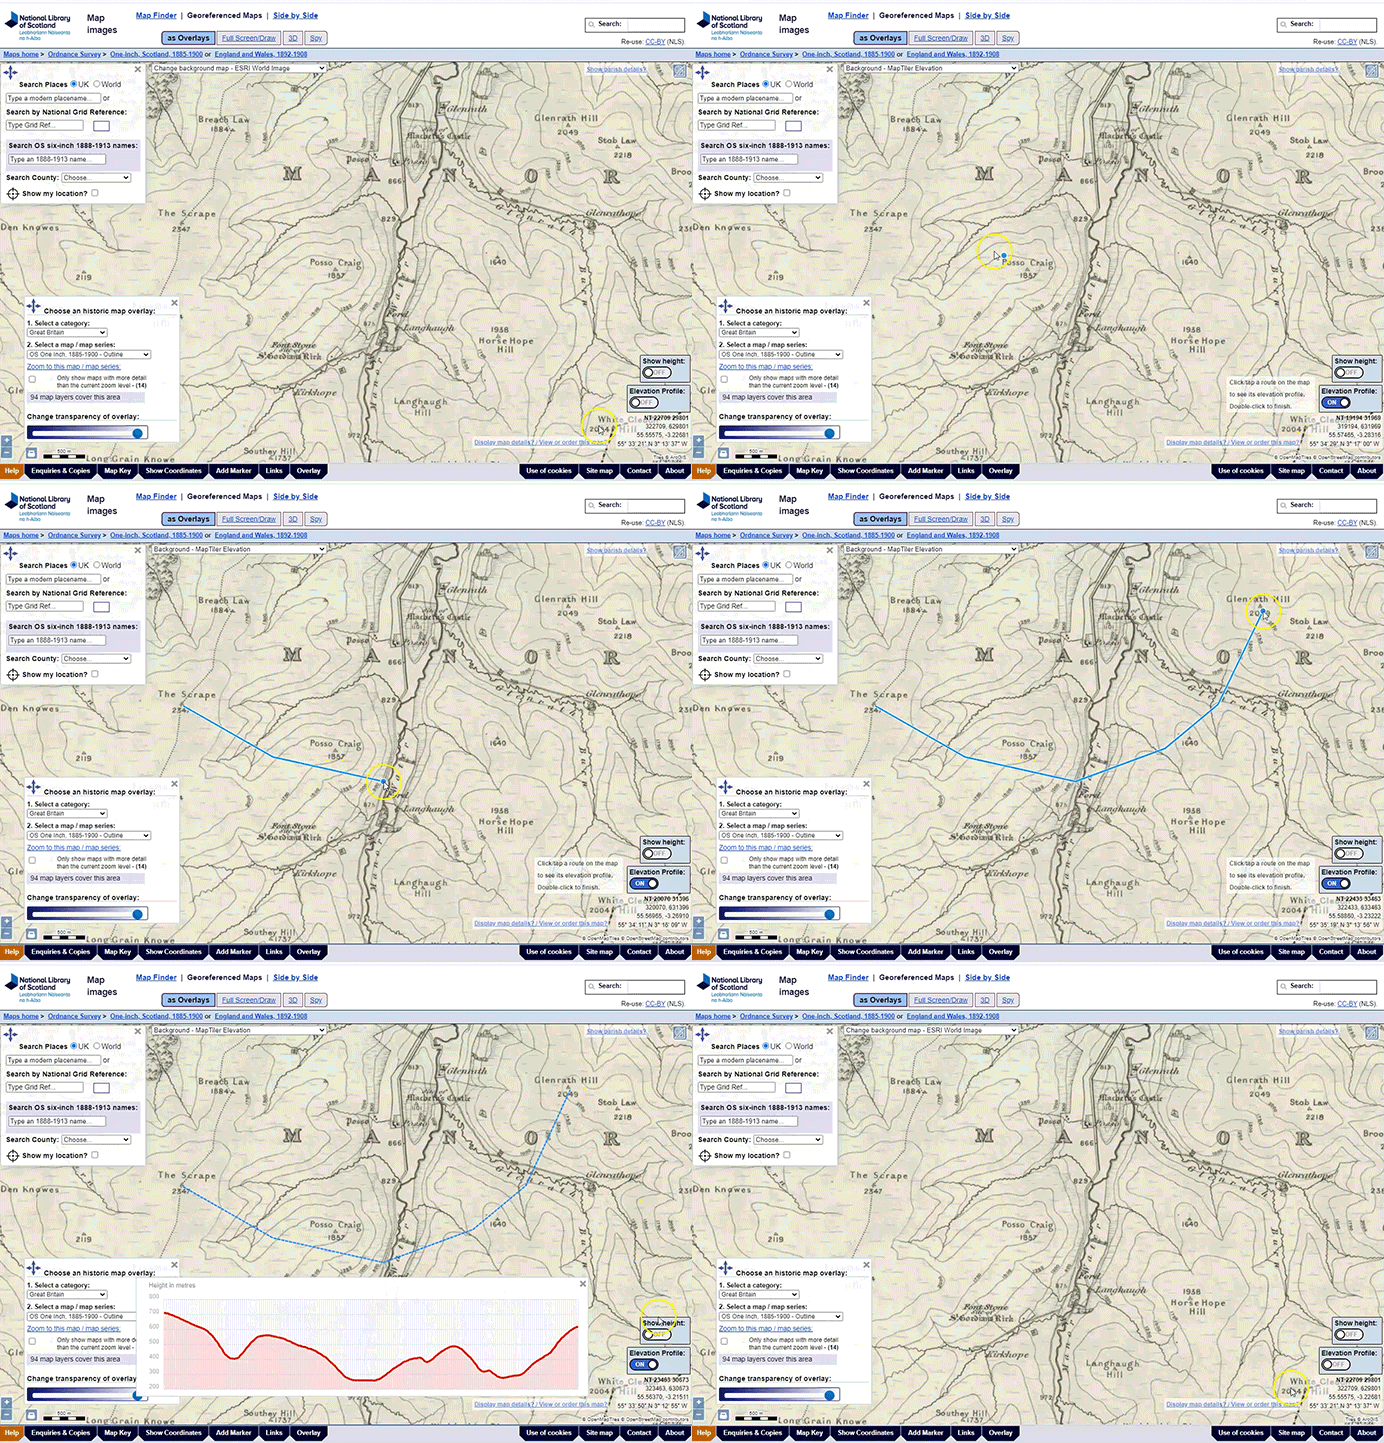
For any location in the Overlay viewer, you can trace a route on the map to view its elevation profile:


- Switch the 'Elevation Profile' button (lower right) to ON.
- Click or tap a line or route on the map.
- Double-click / Double-tap to finish, and an Elevation Profile popup box should appear showing the elevation profile for your line.
TIP: If you need to click points along your route that are close together, zoom in (with the mouse wheel) so that single clicks are not treated like a double-click, finishing your profile route too soon.
The elevation profile is calculated using MapTiler Terrain-RGB data, with elevation information encoded into the RGB values for each pixel. The horizontal resolution of the elevation data is around 30x30 metres. The elevation information is based on present-day terrain, and may sometimes be different from the former terrain at the time of the historic map overlay layers.
Go to Woodland Overlay viewer.
We would welcome information on any mistakes, or suggestions for improvements. Please contact us at maps@nls.uk.


