Ordnance Survey Town Plans of England and Wales, 1840s-1890s
We are very grateful to Dr Robert Wheeler for helpful suggestions and additions to this information below.
Introduction
This series was the most detailed topographic mapping by Ordnance Survey covering towns in England and Wales with more than 4,000 people from the 1840s to the 1890s. By the 1890s, the large-scale town plans covered nearly 400 towns in Great Britain, including 62 towns in Scotland .
We are aware that our holdings are incomplete, so there are some gaps in our coverage. We hope that we may be able to fill these in future through collaborations with other libraries.
Background
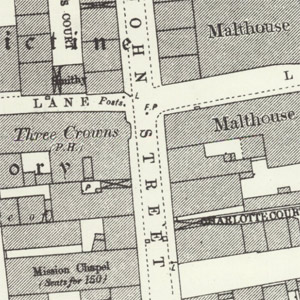
the Three Crowns Pub and Mission Chapel
It had been Irish practice for towns to be surveyed at the five-feet to the mile scale (1:1,056), and this practice continued in northern England when Ordnance Survey work transferred there in the early 1840s. Public health concerns also encouraged the Ordnance Survey's large-scale town plans. The major cholera epidemic of 1832, along with continuing outbreaks of typhus, were strong in people's minds, along with the growing awareness that cartography had provided the vital links to discovering the causes of these diseases. During the 1840s, the Poor Law Commissioners recommended that the Ordnance Survey should create detailed town plans in conjunction with their mapping of counties, for encouraging local authorities to make sanitary improvements. Initial surveying of English towns at the five-feet to the mile scale (1:1,056) took place in the early 1840s in Lancashire, and in December 1846, the Treasury gave authority for the plans to be engraved. Following the Public Health Act of 1848, Local Boards of Health were formed in urban areas, and were given powers to ensure clean water supplies to their districts, as well as control sewers, clean the streets, and regulate slaughterhouses.
Scales
Initially the scale chosen was 1:1,056, or five-feet to the mile, a scale ten times larger than the six inch to the mile mapping (1:10,560) which became the de facto standard for all rural areas. However, for the purposes of sanitary engineering, some argued that the five-foot scale was too small, and a number of towns paid for surveys at the true ten-foot scale (1:528) at the instigation of the Board of Health from 1850 (eg. Alnwick and Berwick-upon-Tweed). Finally in 1855, following pressure from Ordnance Survey and its Superintendent, Henry James, the Treasury approved the mapping of towns at the metric ten-foot scale (1:500). This was used consistently for all new town surveys from this time, with the usual definition of a town being an urban centre with a population of over 4,000 people. Revised editions of towns that had first been mapped at 1:1,056 and 1:528 were sometimes kept at their original scales.
Detail shown
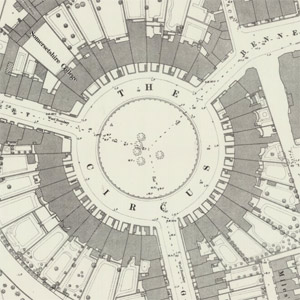
Due to the importance of the maps for urban improvement, many features relating to plotting the locations of drains and pipes are shown, which can include fire plugs, hydrants, water taps, stop-cocks, spot-heights and benchmarks. The maps show the divisions between all buildings, including terraced houses, with glass roofed buildings depicted with cross-hatching. Many industrial and manufacturing premises with details of their type of industry are clearly depicted, along with wharfs, docks, market places, canals, railways and tramways. The maps often show the ground floor layout of public buildings, including cathedrals, churches, almshouses, and railway stations. The exact position of free standing trees, as well as clusters of trees and woodland are also depicted, along with the layout of gardens. The maps are also a useful record of urban public boundaries, often showing the broader County and Municipal Borough boundaries, as well as the more detailed Municipal Ward and Local Board District boundaries.
As with all Ordnance Survey series, there were variations over time, and inconsistencies in the particular features shown from one town to another. Railways are usually shown very comprehensively, but sometimes track information is omitted if the track was roofed over in a station. The definition of which public buildings were included and named can also vary, and reprints of maps often omitted interiors of public buildings. Certain military sites or prisons were often left blank, and the rules regarding these "security deletions" were successively tightened as the century progressed. In spite of their detail, the Ordnance Survey town plans did not include house numbers - these were printed comprehensively by Ordnance Survey only from the 1940s (see our National Grid maps, 1940s-1960s). The maps also do not usually indicate features below ground level, such as cellars, underground utilities or tunnels. For more detail on these and other features, please consult Oliver (2013).
Post-publication revision
Whilst most of the town plan sheets were not revised over their lifetimes, a smaller number carry significant revisions. Sometimes these revisions are noted in the date marginalia in the footer along the lines "New Railways & Houses inserted 1864". However, this is often not the case, and as our holdings are usually of the later states of these maps including revisions, the survey dates given on the map should be treated with caution. Generally, the major causes to these revisions were due to:
- Railways. Sometimes just the specific railway only was updated, but more usually, as the construction of the railway involved significant changes to adjacent buildings and roads, these adjacent elements were also revised and updated. This latter type of wider revision can be seen on many of the Liverpool sheets in the 1860s, where the sheet marginalia confirm changes to related docks, houses, and fences, in addition to the railways.
- Significant buildings. Sometimes the construction of new town halls or hospitals resulted in major revisions to the particular sheets which included them. For example, Halifax Sheet 6 includes the new railway station (opened 1855), the new Town Hall (opened 1860) along with two new streets, and changes to the New Market (probably ca. 1854). This probably reflects general revision of the early 1860s, but the marginalia on the plan has the original date of survey in 1850, and publication in 1852. Lancaster Sheet 19 includes Ripley's Hospital, opened in 1864, but the marginalia on the plan has the original date of survey in 1845, and publication in 1849.
- Security deletions. See, for example, Strangeways Prison in Manchester.
- Marginalia. The note "All Rights of Reproduction Reserved" was added from early 1888, and the price was raised from 2s to 2s6d in September 1888. If a sheet is encountered with either of these, it may be assumed to represent the final revision state. The only exception will be when local authorities paid for revision at this scale, which happened rarely.
Sheet lines and numbering
All of the 1:500 plans were published on sheets that were typically sized ca. 28 x 41 inches (72 x 105 cm), with maps sized 25.34 x 38.02 inches (61 x 96 cm) - A0 size for modern copying. The 1:1,056 plans were published on sheets that were typically sized ca. 28 x 41 inches (72 x 105 cm), with maps 24 x 36 inches (64 x 97 cm) - A0 size for modern copying. The 1:500 sheets each cover an area of 38.4 acres (15.54 hectares) on the ground. The 1:500 sheets are subdivisions of 25 sheets (5 x 5) of the OS 25 inch to the mile sheet lines, carrying a Roman numeral of their parent 25 inch sheet (eg. XI.12), and then a sub-number from 1-25 (eg. XI.12.18). The 1:1,056 sheets are usually laid out on local sheet lines unrelated to the parent County Series mapping - although in a few cases, they are subdivisions of the six-inch County Series maps (for example, the London, 1893-96 large-scale town plan).
Printing and changes in style
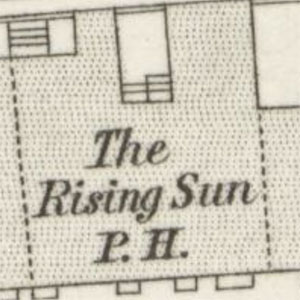
horizontal lines of dots
The earlier editions of these scales from the 1840s to the 1870s were printed from large, engraved copper plates. However, there was a growing trend to print maps using zincography during the second half of the 19th century, and many of the 1:500 scale plans were zincographed. Zincography was a lithographic printing process, with the map image traced using litho-transfer ink onto large plates of specially prepared zinc. Zincography was introduced into OS from the 1850s for the 1:2,500 scale maps, but expanded particularly from the 1870s, as it was cheaper than copper plate engraving, and more dimensionally stable. Zincography created much bolder maps with thicker lines, symbols and larger fonts, compared to the line work of the engraved maps. From the 1880s, engraved sheets were often transferred to zinc directly, rather than by zincography; by this date there is little difference in image quality.
The early engraved maps usually depict buidlings without any building fill. As this made them difficult to interpret, roofed buildings were later shown by rouletting - horizontal lines of dots created by a special tool.
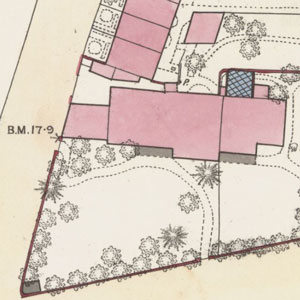
roads and glasshouses
The zincographed maps were issued in uncoloured and coloured forms, the latter at extra cost. Carmine/red was used for stone or brick buildings, rich carmine/red for solid walls, grey for wooden or metal buildings, sienna for roads, and blue for water or glasshouses. Free-standing walls were coloured solid red, whilst those that formed part of a roofed structure, had the lighter red colour-wash applied to the whole structure. This made garden walls very prominent in relation to the buildings they surrounded. Perhaps for this reason, perhaps because of the cost of hand-colouring large areas of building, the zincographed form had changed by the 1880s to using diagonal hatching for building-fill and the hand-coloured form ceased to be available.
By the 1880s, when sheets were produced by zincography, it was usual to print a batch of sheets - perhaps enough to last the lifetime of the map - and re-use the zinc plate. If a further batch was required prior to about 1900, the map was rezincographed, working from the master drawing again. Thus, names will be in different positions and fonts may change slightly. The linework on the 1:500 is so straightforward that changes from the redrawing will not usually be apparent. Nevertheless, when the placement of a name is ambiguous or there is doubt about the interpretation of fine detail, it may be worth seeking out different zincographings, bearing in mind that these are independent copies of the same master drawing. After about 1900, if further copies were needed they were produced from an existing printed map by a photographic process, usually heliozincography.
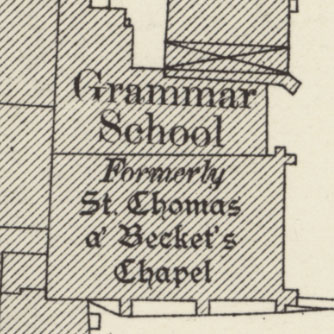
hatching
It is not possible to rely on a marginal note 'Published and Zincographed in ...' except as a statement of cartographic history: maps could be re-zincographed without that statement being changed. It is therefore useful to know that after about 1889, minor abbreviations of a sanitary nature (like M.H. for man-hole) were printed in a sans-serif font; this is often a useful aid to distinguishing an original batch from re-zincographs.
The 1:500 scale was favoured by municipal engineers for planning improvements to road junctions and the like. In consequence maps from the original large-scale survey remained in use even when the 1:2,500 had benefited from a couple of later revisions.
The end of the series
In 1894, the Treasury recommended that large-scale town plans should only be made on a repayment basis by particular towns. Fourteen towns were mapped on this basis until 1909, but the official publication of the maps by Ordnance Survey ceased. In the 20th century, the largest scale mapping of towns has been the OS National Grid 1:1,250 series, initiated in the 1940s.
Further reading
- Oliver, Richard R., 2013. Ordnance Survey Maps: a concise guide for historians, 3rd revised & enlarged edn. (London: Charles Close)
- Oliver, Richard R., 2014. The Ordnance Survey in the nineteenth century: maps, money and the growth of government, (London: Charles Close)
- Oliver, Richard R. and Kain, Roger J.P., 2015. The Catalogue of British Town Maps. An online catalogue of over 8,000 records of maps held in British libraries and archives.
- Sankey, H. Riall, 1995. The maps of the Ordnance Survey: a mid-Victorian view (London: Charles Close)
- Seymour, W.A., 1980. A history of the Ordnance Survey (Folkestone, Kent: Dawson)
- Smith, David, 1988. Maps and plans for the local historian and collector (London: Batsford)
- Wheeler, Robert, 2024. 'The 1:500 of Lincoln', Sheetlines 129 (April 2024), pp. 43-46
