Ordnance Survey Maps, London, Large-Scale Town Plans, 1840s-1890s
Introduction
The Ordnance Survey mapped London at the Five-foot to the mile or 1:1,056 scale from the 1840s, initially reducing this to 1:5,280 in the 'Skeleton Survey'. More comprehensive editions followed in the 1860s, and 1890s, with a further edition in the 1900s for Land Registry purposes:
- View 1:5,280 'Skeleton Survey' - 42 sheets (1848-51)
- View 1:1,056 Large Scale Town Plan - 272 sheets (1862-74)
- View 1:1,056 Large Scale Town Plan - 753 sheets (1893-96)
- View 1:1,056 (Land Registry Edition) Large Scale Town Plan - 310 sheets (1893-1923)
- View 1:1,056 Large Scale Town Plan - 93 sheets (1935-37)
Background

from Sheet VII.83 (1896)
Public health concerns provided the initial rationale for the Ordnance Survey large-scale town plans. The major cholera epidemic of 1832, along with continuing outbreaks of typhus, were strong in people's minds, along with the growing awareness that cartography had provided the vital links to discovering the causes of these diseases. During the 1840s, the Poor Law Commissioners recommended that the Ordnance Survey should create detailed town plans in conjunction with their mapping of counties, for encouraging local authorities to make sanitary improvements. Following the Public Health Act of 1848, Local Boards of Health were formed in urban areas, and were given powers to ensure clean water supplies to their districts, as well as control sewers, clean the streets, and regulate slaughterhouses.
Between 1848 and 1850 an initial survey of London at the five-foot to the mile or 1:1,056 scale was undertaken at the instigation of the Metropolitan Commissioners of Sewers, encouraged by Edwin Chadwick and other health campaigners. Chadwick recognised the importance of a large-scale survey of London with accurate height information for planning sewers, even if the maps omitted the range of other detail typically included at this scale for other towns. The 487 sheets covering central London were numbered individually and laid out on the St Paul's meridian. The campaigns of James Wyld II MP against the Ordnance Survey and their work in London successfully limited the detail included on the plans and their derivative scales to outlines. Wyld criticised the expense of the Survey and their use of sappers and miners rather than private surveyors, although this was hardly a detached perspective, given Wyld's own business as a map publisher based in London. A set of 44 plans, reduced from the 'Skeleteon Survey' to a scale of 12 inches to the mile or 1:5,280 were published (View Skeleton Survey plans).
There were continuing arguments during the 1850s between Ordnance Survey and the Metropolitan Commissioners of Sewers, and their successors from 1856, the Metropolitan Board of Works, over who should pay for the 'skeleton survey'. In 1863, the Treasury authorised work on filling in the detail of the 'skeleton survey', a large undertaking, that took eight years to complete, and a further five years for all 326 sheets to be engraved. The sheets were renumbered as divisions, numbered from 1 to 100, of the OS six-inch to the mile sheets. A reduction of the survey to the 25 inch to the mile scale in 90 sheets, begun in 1871, was not complete until 1880 (View 1860s plans)
The 1:1,056 revision of the 1890s proceeded generally from the north-west to the south-east, with some more central sheets revised from earlier editions, and other more peripheral sheets based on an original survey, as specified in the lower left of each sheet (View 1890s plans) .
Scales
The five-foot to the mile scale or 1:1,056, was ten times larger than the OS six inch to the mile mapping (1:10,560), the de facto standard for all OS rural mapping. Although from 1855, the nation-wide mapping of towns with more than 4,000 inhabitants at the metric ten-foot scale (1:500) was authorised, those towns originally surveyed at the five-foot scale such as London were often revised at the same scale for later editions. At the 1:1,056 scale, an inch on the map measured 88 feet on the ground, so each sheet covered an extent of 704 x 1056 yards on the ground, or an area of 743,424 square yards (0.24 square miles).
Detail shown

Tyers Gate, near London Bridge
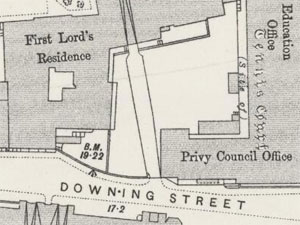
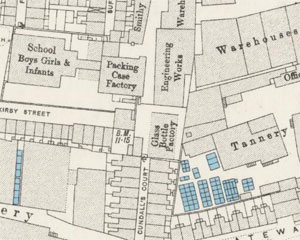
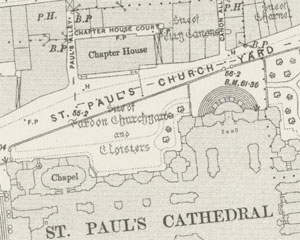
Due to the importance of the maps for improving urban sanitation, many features relating to water supply, sewerage, drainage and gas supply are shown, including fire plugs, hydrants, water taps, manholes, stop-cocks, spot-heights and benchmarks. The maps show the divisions between all buildings, including terraced houses, with glass roofed buildings depicted with cross-hatching. Many industrial and manufacturing premises with details of their type of industry are clearly depicted, along with wharfs, docks, market places, canals, railways and tramways. The maps also show the ground floor layout of public buildings, including cathedrals, churches, and railway stations. The maps are also an excellent record of urban public boundaries, showing the broader County and Municipal Borough boundaries, as well as the more detailed Municipal Ward and Local Board District boundaries.
Sheet lines and numbering
All of these plans were published on sheets that were typically sized ca. 29 x 41 inches (74 x 105 cm), with maps 24 x 36 inches (61 x 92 cm) - A0 size for modern copying. The sheets are subdivisions of 100 sheets (10 x 10) of the OS six-inch to the mile sheet lines, carrying a Roman numeral of their parent six-inch sheet, and then a sub-number from 1-100 (eg. XI.59)
Printing

from Sheet VII.65 (1896)
The earlier editions of OS 1:1,056 maps of London from the 1850s to the 1880s had been printed from large, engraved copper plates. In contrast, the 1890s 1:1,056 maps were printed by zincography. Zincography was a lithographic printing process, with the map image traced using litho-transfer ink onto large plates of specially prepared zinc. Zincography was introduced in OS from the 1850s, but expanded particularly from the 1880s, as it was significantly cheaper than copper plate engraving, and corrections were easier to make. Zinc plates were also lighter and easier to store than large stones traditionally used for lithography. Zincography created much bolder maps with thicker lines, symbols and larger fonts, compared to the fine, delicate line work of the engraved maps. The Ordnance Survey 1:1,056 maps were generally uncoloured, but blue wash was used for water features on selected sheets, as for other scales of mapping in the 1890s.
Further reading
R.N. Hyde, Printed Maps of Victorian London (London, 1975).
Richard R. Oliver, Ordnance Survey Maps: a concise guide for historians, 2nd revised & enlarged edn. (London, 2005).
