Further information - Ordnance Survey National Grid maps, 1944-1973
These maps are most detailed Ordnance Survey maps after the Second World War covering all parts of England, Scotland, and Wales. The maps provide an unrivalled insight into the urban and rural landscape of England, Scotland and Wales in the mid-20th century.
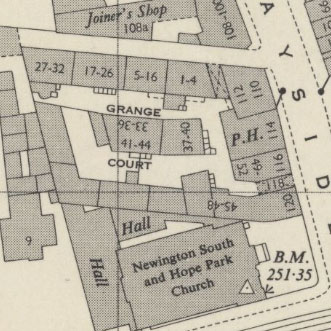
Ordnance Survey 1:1,250
Summary: The most detailed OS post-war series, covering all urban areas with more than about 20,000 inhabitants. Black printed detail, no colour.
Detail shown: 1 cm on the map represents 12.5 metres on the ground. All permanent objects covering 8 metres2, as well as most detached features covering 1 metre2 are usually mapped. Shows divisions between houses, house numbers, public and industrial buildings, railways, pavements, streets and street names, parkland and trees, paths, spot heights, and all administrative urban boundaries to scale (i.e. without generalisation and reduction of detail).
Revision: Continuously revised. New paper sheets produced after 300 house units (see note) of change. After 1973, urban areas with 1:1,250 scale maps did not have 1:2,500 maps published for them, so only the 1:1,250 scale provides complete coverage through time.
Editions: Consecutive letters for full sheet revision (A, B, C, etc.) with A/, A*, etc. indicating partial revision. Usually to lower left of map.
Symbols and boundaries: View selected symbols and boundaries (1:1,250/1:2,500)
Standard area covered: 500 metres x 500 metres
Standard map size: 40 cm x 40 cm
Sheet size for copying: A1
Typical sheet reference: NT2672SW
View map sheets (1:1,250) or a georeferenced layer (1:1,250 A edition)
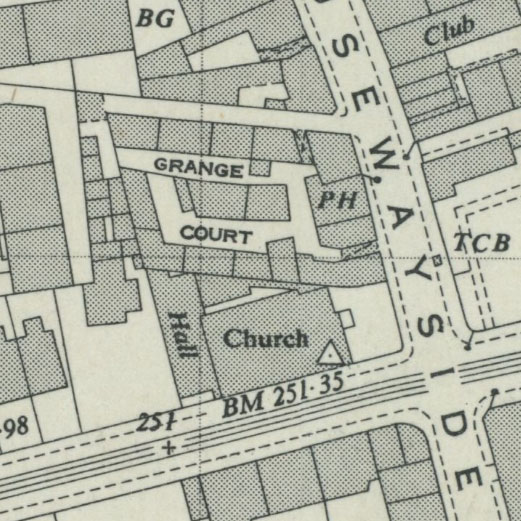
Ordnance Survey 1:2,500
Summary: The most detailed OS series for all inhabited areas and cultivated land. Black printed detail, no colour.
Detail shown: 1 cm on the map represents 25 metres on the ground (one square inch roughly equals one acre on the ground). All permanent objects covering 16 metres2 as well as most detached features covering 2 metres2 are shown. Shows divisions between houses, public and industrial buildings, railways, roads, parkland, paths, field numbers and acreages, land-use and trees, spot heights, place names and all administrative urban and rural boundaries. A standard topographical authority showing all significant man-made and natural features to scale (i.e. without generalisation and reduction of detail). Originally began in the 1850s as the 25 Inch to the mile scale
Revision: Continuously revised. New paper sheets produced after 300 house units (see note) of change for single sheets or 450 house units (see note) of change for double sheets.
Editions: Consecutive letters for full sheet revision (A, B, C, etc.) with A/, A*, etc. indicating partial revision. Usually to lower left of map.
Symbols and boundaries: View selected symbols and boundaries (1:1,250/1:2,500)
Standard area covered: 1 km x 1 km (single km square) or 1km x 2km (double km square).
Standard map size: 40 cm x 40 cm (single km 2) or 40 cm x 80 cm (double km2)
Sheet size for copying: A1 (single km2) or A0 (double km2)
Typical sheet reference: NT2672 (single km2) or NT2672-2772 (double km2)
View map sheets (1:2,500) or a georeferenced layer (1:2,500 A edition)
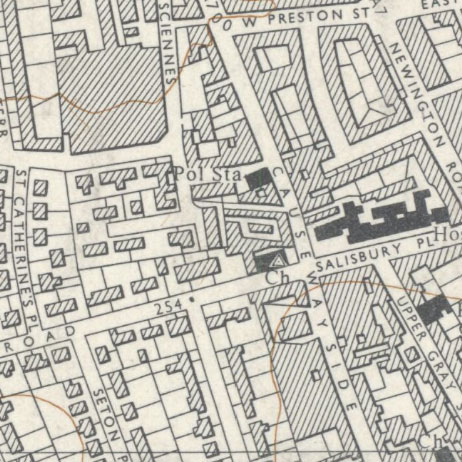
Ordnance Survey 1:10,560/1:10,000
Summary: A standard topographical authority for many purposes and especially useful for rural areas. The most detailed OS series covering the whole of Great Britain. For moorland and mountainous areas, the most detailed OS series (basic scale) but still useful for an overview of more settled and urban areas, where information is derived from the more detailed 1:2,500 and 1:1,250 scales. Originally began in the 1820s in Ireland as the Six-Inch to the mile scale. The Six-Inch scale is 1:10,560. From 1970 it was metricated and published at 1:10,000. Black printed detail, with orange coloured contours.
Detail shown: 1 mm on the map represents 10 metres on the ground, so there is considerable generalisation of features such as buildings, streets and railways that are not shown in plan form. Shows houses blocked together, public and industrial buildings, railways, roads, field boundaries, land-use and trees, contours and spot heights, place names and all administrative rural boundaries. The 1:10,560 is the most detailed / largest scale OS map to show contours (lines of equal height).
Revision: The series was published for all of Great Britain between the 1940s and the 1970s. There are often two to four editions of mapping for areas undergoing more significant change, but only one edition for sparsely populated rural areas. New paper sheets produced after 500 house units (see note) of change
Editions: Consecutive letters for full sheet revision (A, B, C, etc.) with A/, A*, etc. indicating partial revision. Usually to lower left of map.
Symbols and boundaries: View selected symbols and boundaries (1:10,560)
Standard area covered: 5 km x 5 km (with occasional enlargements/extended sheets on coasts).
Standard map size: 50 cm x 50 cm
Sheet size for copying: A1
Typical sheet reference: NT27SE
View map sheets (1:10,560/1:10,000) or a georeferenced layer (1:10,560 A edition)
Note: 'House units' — The method of quantifying change used by the Ordnance Survey whereby the addition of a complete, independent building to the map counted as a 'house unit'. The following equivalents for house unit purposes were in use in the 1960s and 1970s:
- Demolition of a house without the addition of new features as 0.5 unit
- Large buildings as 15-20 units per hectare
- Motorways, dual-carriageways and major public roads; standard gauge railways as 5-10 units per 100 metres
- Minor public roads and private roads as 2-5 units per 100 metres
- Tracks and narrow guage railways as 2 units per 100 metres
- Power lines as 2 units per 100 metres
- Reservoirs as 2 units per hectare
- Altered high or low water marks: 1 unit per 100 metres
- Altered house numbers or names as 1 unit per 10
- Altered names of roads or buildings as 1 unit
- Altered administrative, physical and district names as 2 units
For more information on 'house units' and these maps, please consult Richard Oliver's book Ordnance Survey maps: a concise guide for historians. 3rd edition (London : Charles Close Society, 2013).