Ordnance Survey Maps - Six-inch 1st edition, Scotland, 1843-1882
In this section
- Introduction and summary history
- Triangulation and the Battle of the Scales
- Content of the maps and naming places
- Surveying, levelling, contouring and production methods
- Wider context, conclusion, references and further reading
Surveying, levelling and contouring

View larger image
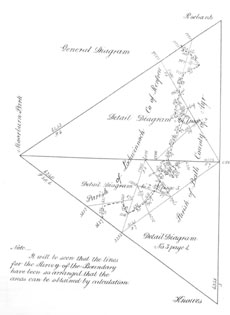
With its origins in Ireland, all the larger-scale maps of Great Britain carried out in the later 19th century were compiled through the technique known as 'chain surveying by triangles'. The surveyors, often a combination of civilians and sappers, were organised into section of eight to 12 men, supervised by a superintendent, usually a non-commissioned officer. The chain was typically a standard Gunter chain of 66 feet divided into 100 links, and the unit of work was a triangle formed by the adjacent triangulation stations. With the main sides of the triangle and its distances chained, several split lines could then be chained running across the triangle, and a larger number of detailed lines chained or measured using a cyclometer to pick up distances to all features. Special methods were used in sloping ground, either using horizontal chains and a plummet or drop arrow, or tables of corrections for different angles of slope to calculate true lengths. In uncultivated or mountainous areas, and in wooded districts, the framework for detail survey was provided mainly by theodolites and chain traverses, or by a mixture of traverses and local chained frameworks. Through these methods, usually originating and terminating at a triangulation station, a set of lines and their angles could be measured to fix the position of isolated houses, etc. Some final distances were often sketched or paced, either by eye or using box sextants or azimuth prismatic compasses. This was often arduous work. In 1852, looking back to survey work carried out as a junior officer in 1819 in the company of Colby, Major-General Dawson recalled soldier-surveyors snow-balling one another to keep warm after a snowstorm – in June – and repeated lengthy walks as Colby led the 'station hunt' – to find suitable hills for future encampments and trigonometric measurements.
The first application of contours in Great Britain was in Scotland in 1777 on Schiehallion in Perthshire, where Charles Hutton (Professor of Mathematics at the Royal Academy) and Nevil Maskelyne (Astronomer Royal) attempted to derive the mean density of the Earth. Historically, and on early Ordnance Survey maps, hachures (lines of variable thickness sketched along the direction of slope) were used to indicate relief, and contours were only introduced on Ordnance Survey maps by Thomas Larcom in the later mapping of Ireland in the 1830s. Contouring depended upon accurate levelling, the creation of a network of accurate spot heights along principal communication channels measured using Gravatt levels and ordinary Y levels. Its inclusion as a standard feature took some years. As a feature on maps, contours were expensive to include. In visualising topography, engineers found them less good than hachuring. As late as 1856, Sir Roderick Murchison, in giving evidence to a Parliamentary Select Committee on the Survey's work in Scotland, raised the possibility of contours not being employed but instead 'combining the old system of hill-sketching and measurement of heights', a combination which 'might materially tend to procure for us the publication of a real geographical map of the Highlands in a reasonable number of years'. His solution was not adopted. Following the determination of mean sea level at Liverpool in 1844, the primary levelling of the whole country was completed by 1860 (finishing at Ballinluig, by Pitlochry). This formed a suitable base for more detailed secondary levelling, to fill in a more detailed pattern of spot heights, bench marks and contours.
Levelling and measuring heights

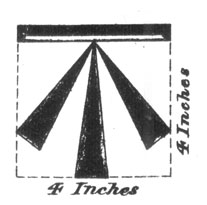
Levelling operations allowed the construction of bench marks [see note 4], permanent marks about knee height on durable structures such as stone walls or gateposts, with their altitudes accurately recorded. Approved after 1854, they usually appear as an incised horizontal bar with a broad arrow immediately below, the height of the bar accurately determined by spirit levelling and recorded on Ordnance Survey maps (Illustration, James, p. 138). Contouring would usually begin from a bench mark, with a line of levels run up a slope with the telescope line of sight set to horizontal until a particular altitude was obtained. The horizontal altitude of the contour could then be surveyed using a chain and theodolite, with positions marked by pickets, aiming to close the contour to within 0.1 foot in flat country or 0.3 foot in hilly country. (pg. 131, Winterbotham). Such contours using spirit levels were termed 'instrumental contours', but required a team of two covering 1.4 miles per day. As a result, water-levelling was used, which required just one person who could cover nearer four miles per day. The water-level used coloured water inside a U-shaped tube, connected to a prismatic compass, but gave far less satisfactory results. Later investigations of 19th-century Scottish contours and altitudes revealed errors of up to 100 ft in altitude and up to 0.75 km in planimetry (Collier, 1972). As Ordnance Survey policy changed during the 1850s and 1860s, later Scottish counties were contoured with progressively larger height intervals and for steadily lower altitudes, and most of the Highland regions had no instrumental contours at all. Water-levelled contours were only considered accurate enough for the smaller scale one-inch to the mile maps, and so most six-inch maps of Highland regions carry no contours.
Production methods
By the 1860s, Ordnance Survey map production was much influenced by the reforms of both Thomas Colby, Director from 1820-1846, and Henry James, Director from 1854-1875. Colby introduced new standards of accuracy with less sketching and more checking of work, and with pay linked more closely to quality. Under Henry James (1803-1877), 'an archetypal Victorian captain of industry' (Sankey, 1995, Introduction), new techniques, a greater specialisation and division of labour, and a drive towards greater efficiency all featured. As a result, the various compilation methods involving ground survey, delimitation of boundaries, measurement of acreages, levelling and contouring, and recording of place names were often undertaken by different men, and their work synthesised and plotted by others. Several cross-checks for accuracy and the planimetric regularisation of errors were required before a manuscript plan was examined both on the ground by the division officer and back in the office in Southampton before being engraved.
Engraving on copper plates
Apart from the final maps of Scottish islands printed using zincography after 1880, the six-inch maps of Scotland were engraved on special hammered copper, 1/10th inch thick and measuring 26.5 by 38.5 inches in extent. After scoring the sheet lines and marking the position of trigonometrical stations with fine dots, the plates were covered with wax, the outlines copied from tracings, and then cut into the plate in reverse using a graver or burin. Names and ornament were added next, with both stencils and steel punches increasingly replacing engraving in the production of later maps. The ruling of parks and sands was done with a special ruling machine, using a fine milled wheel or 'roulette', and the cross hatching of buildings using another ruling machine fitted with a diamond point (James, Plate 1-6?). Darker lines and features could be selectively deepened using etching acid. Proofs were taken regularly during the process and corrections made at each stage. Map engraving was a highly specialised process, and took a long time with high quality results. In time the engravers became the highest paid branch of the Survey.
Printing

View larger image
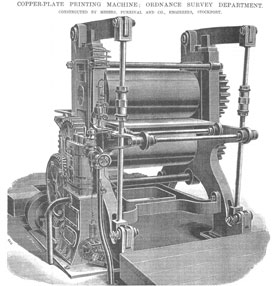
Once ready for printing, the plate would be thoroughly cleaned, daubed with printing ink to force the ink into the engraved lines, and then the plate was cleaned again to remove ink from other parts. Extensive experimentation involving paper, ink, temperature, humidity, and printing presses resulted in a gradual perfection of techniques during the later 19th century. For example, by wetting the paper, better impressions could be obtained, but the paper often shrank in an uneven way; through higher pressure steam-powered presses, and only sprinkling the paper with water, could more accurate high-quality results be obtained. The steam-powered copper-plate printing machine, constructed by Furnival & Company in Stockport could create a pressure of up to 40 tons, required for better results, and so, typically, a copper plate could only make about 500 impressions before re-engraving or copying by electrotyping was required. Especially from the 1870s, the need for cheaper production methods lead to the increasing use of zinc instead of copper, the use of photographic techniques, including photo-zincography and helio-zincography, as well as electrolysis and lithography.
"Railway" additions and related variant states
Following the initial survey of counties in the 1840s-1880s period, a small proportion of the OS six-inch to the mile sheets were reprinted with updated information on them, but usually with no change to the survey and publication dates in the map margins. This is particularly true of sheets that show new railways, constructed after the original surveying of the particular county maps. Very often for these particular sheets, topographic details immediately adjacent to the new railway that had often changed, such as industrial buildings, houses, field boundaries, roads, and watercourses, were also updated and added to the revised map. This includes some private railways that connected sites such as coal pits to the new line. However, importantly, the rest of the topographic features on the map sheet were not revised. This routine addition of new railways stopped around 1868.
As these new "railway" states usually have the same survey and publication dates as their parent sheet before the railway, we have added a note (Railways to ca. XXXX) after the survey and publication dates in the map header (eg. Ayrshire, Sheet XLIV. This date has been estimated from official sources based on the opening date of the railway in question, which is hopefully correct to the nearest few years. The Ordnance Survey rarely noted the addition of these new railways in the marginal information on the sheet, although an interesting exception, on Kirkcudbrightshire Sheet 44 notes in red "Railway inserted since date of publication hereon".
In some other cases, Ordnance Survey revised the sheets for towns that were changing rapidly or which had updated surveys at the larger scales of five-foot or ten-foot to the mile. This is true for Edinburgh (Edinburghshire, Sheet 2 carries a note in the lower margin "Revised in 1877 within the limits of work surveyed at the 1/1056 scale") and Dundee (Forfarshire, Sheet LIV carries a note in the lower margin "Dundee. Revised in 1872"). However, a preliminary investigation has not found similar updated sheets for other Scottish towns.
A further category of significant updates to map sheet content relate to sheets at county boundaries. Originally, these were mapped just up to the boundary, leaving the adjacent county area blank. Following the mapping of the adjacent county, Ordnance Survey sometimes chose to reprint a sheet on the boundary by adding material from the adjoining county (or counties), with map detail filling the whole area. These filled sheets often add to the title the numbers of the sheets from the adjacent county, and sometimes adjust survey and publication dates accordingly into a range from all the sheets (eg. Perthshire XXV ).
Later states of the OS six-inch maps can also reflect changing rules on security deletions, changes to administrative boundaries, and spot heights. Ornament might be refreshed where the plate had become worn. In the case of garden ornament (eg at Pollokshaws on Renfrewshire XIII) this can look like substantive changes, but is merely the way the engraver indicated land use.
There were sometimes other changes to marginal information between sheets. For example, the price noted in the lower margin fell in 1866 from five shillings, to two shillings and sixpence for a full sheet.
Most of our maps also carry an embossed printing date, a stamp usually in the top margin in the centre, which carries the date of printing. We have not recorded this information online, but we have used it in our County lists to distinguish earlier from later printings of particular sheets.
Our online holdings of OS six-inch maps are of two (incomplete) sets of flat sheet maps. We also hold a further set of OS six-inch 1st edition maps inside bound volumes, which we hope to be able to scan in future when we have a suitable overhead camera for this purpose.
 Next: Page 5 of 5
Note 4:
The name derives from the angle iron which is fitted into the horizontal cut to give a 'bench' or support for a levelling staff.
 Back to paragraph 3
