Using LiDAR layers for landscape research
Light Detection and Ranging (LiDAR) is an airborne mapping technique, which uses a scanning laser to very accurately measure the distance between the aircraft and the ground. It allows highly detailed representations of relief or terrain models to be generated, often at spatial resolutions of between 25 cm and 2 metres.
LiDAR has many uses, and is particularly valuable for showing subtle variations in relief or elevation on the ground. Slopes and small streams are easy to spot, as well as types of trees and their densities. LiDAR can also be ground based rather than airborne and is often used in self-driving vehicles for showing relief and obstructions. LiDAR data has many archaeological applications due to its ability to show the underlying land surface with vegetation removed and to show up patterns of small variations in elevation which are often not visible to the human eye at ground level.
This page offers brief guidance on using LiDAR layers on our maps website for landscape research.
- LiDAR surveys and outputs
- Resolution
- Colour and hillshade
- Geographic extent
- Viewing the LiDAR layers
- Examples of LiDAR for particular sites
- Sherwood Forest
- New (Feb 2024): Expanded and enhanced DTM layer covering Wales
- Re-using LiDAR layers
- Acknowledgements
- Further information
LiDAR surveys and outputs
LiDAR surveys are undertaken during winter months (approximately November to April each year) when trees are without leaves, to ensure the most accurate survey of the ground. Up to 500,000 measurements per second are made of the ground, measuring height to an accuracy of better than ±15cm. (This is the root mean squared error or RMSE, quantifying the difference between the Ground Truth Survey and the LiDAR data).
The survey data is then processed into different outputs for different purposes:
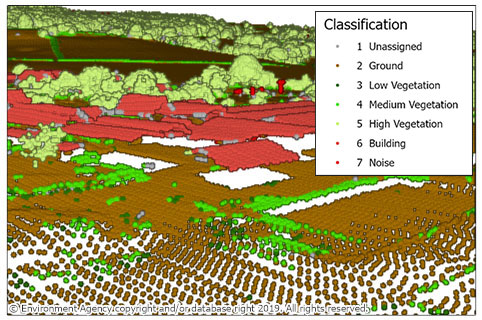
- The LiDAR Point Cloud is the raw set of points derived from the LiDAR pulses which are returned to the sensor. These points are used in the creation of the surface models below. The points can be classified into a number of categories (such as ground, buildings, or low, medium and high vegetation) using an automated classification process.
- The Digital Surface Model (DSM) is a representation of object heights such as vehicles, buildings and vegetation, and is created from all the returned LiDAR pulses which are classified as having come from both the ground and from surface objects.
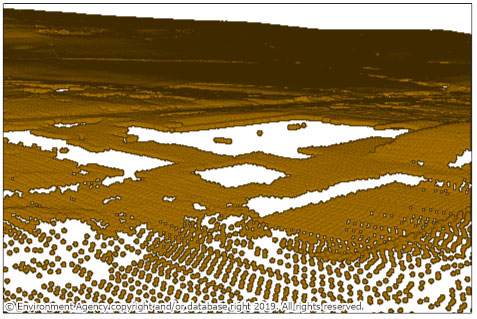
- The Digital Terrain Model (DTM) is a representation of the ground level, created from the returned LiDAR pulses which have been classified as coming from the ground. Manual filtering is undertaken on the DTM to improve the automated classification routines to produce a most likely ground surface model. Areas of no data, such as water bodies, are also filled to ensure there are no gaps in the model.
Resolution
For a 1m DSM surface model the point cloud will have an average point density across the survey of at least 1 point per square metre (ppsqm). For 50cm this increases to 4 ppsqm and 25cm resolution is 16ppsqm. The point density is calculated for the DSM and not the DTM, as under vegetation the point density that makes up the DTM will not necessarily have 1ppsqm at 1m resolution. The point density also varies across the scan - increasing where you have overlap from multiple flightlines and can also vary in forward scan direction in areas where the terrain changes significantly.
Colour and hillshade
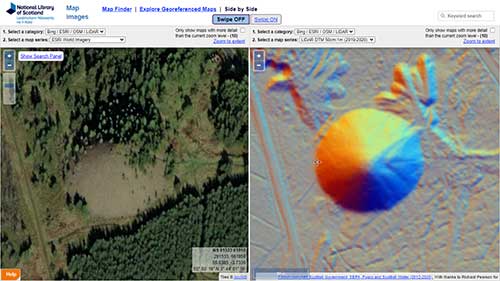
The DSM or DTM LiDAR data also can be presented in a very wide range of different ways. It is often styled using a colour ramp for altitude, where different heights are represented by different colours or shades. Generally, one colour will blend into the next in a graduated progression. A hillshade is a different visualisation technique which illustrates what a land surface would look like if it were illuminated from a given direction, with the light source illuminating the landscape with a varying degree of brightness, depending on the angle between the slope and the light source at each point on the surface. The hillshade thus enables the more minor or subtle variations in relief to be picked out. The standard English and Welsh LiDAR data on our website has a basic colour ramp for altitude, which is then combined with a hillshade generated by illumination from a single direction.
The default Scottish DSM and DTM layers available online also use a colour ramp for altitude, but without a hillshade, so that minor topographic features cannot be seen. We have therefore downloaded and reprocessed the Scottish DTM layers using the Relief Visualisation Toolbox, which is able to generate more useful visualisations from the same source data. We have generated 3 channel (Red, Green and Blue) hillshade images which show how the land surface would look if illuminated from 3 different compass directions at the same time (ie. as if we had 3 suns). The red channel 'shines' from 315 degrees, the green from 15 and the blue from 75. We used RVT's default sun elevation angle (height above the horizon) of 35 degrees. This multi-direction hillshade effect has the advantage of picking out minor landscape features more clearly than a single direction hillshade. (See Acknowledgements).
Geographic extent
The geographic extent of available LiDAR data continues to grow substantially. By 2021, the Environment Agency had flown over 95% of England at 1 metre resolution. Natural Resources Wales have LiDAR DTM and DSM data at 1 metre covering 100% of Wales. In Scotland, around 45,000 km2 were available by 2021, which due to some overlaps covers around 40% of the country. A Phase 5 release in early 2022 provided additional coverage of the greater Glasgow and Edinburgh environs, whilst a Phase 6 release in late 2022 provided additional coverage of parts of Renfrewshire and North Ayrshire.
In early 2022, we were pleased to collaborate with the Miner 2 Major Veiled Landscape project to add their 16 cm resolution LiDAR models of the Sherwood Forest, flown in 2021, to our website. Read further details in our Sherwood Forest section below.
Viewing the LiDAR layers
- At present for Scotland the LiDAR DTM 50cm-1m layer shows the processed LiDAR data with multi-direction hillshade. The different phases of Scottish LiDAR data that have been released since 2012 can also be viewed separately, which is sometimes useful where they overlap. So to view the best micro-topography for Scotland, choose the LiDAR DTM 50cm-1m (Eng, Scot, Wales) or one of the separate phases, ie. LiDAR DTM 1m (Scotland) Ph 1.
- You can view the composite LiDAR DTM layer for England, Scotland and Wales as a background layer in our Georeferenced Maps viewer by choosing the Background layer - LiDAR DTM 50cm-1m (Eng, Scot, Wales) from the drop-down list in the centre top of the screen.
- You can view the composite LiDAR DTM layer for England, Scotland and Wales in our Side by side split-screen viewer by choosing:
- Select a category: ESRI / OSM / LiDAR, and then
- Select a map series: LiDAR DTM 50cm-1m (Eng, Scot, Wales)
- You can view the Sherwood Forest 16cm LiDAR DTM or DSM layers in our Side by side split-screen viewer by choosing:
- Select a category: ESRI / OSM / LiDAR, and then
- Select a map series: LiDAR DTM 16cm (Sherwood Forest) or LiDAR DSM 16cm (Sherwood Forest)
The layers available in the drop-down lists reflect those which have coverage of the area you are viewing on screen.
Examples of LiDAR for particular sites
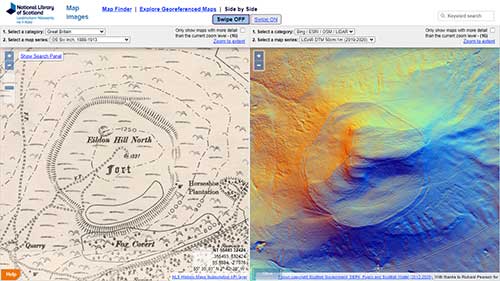
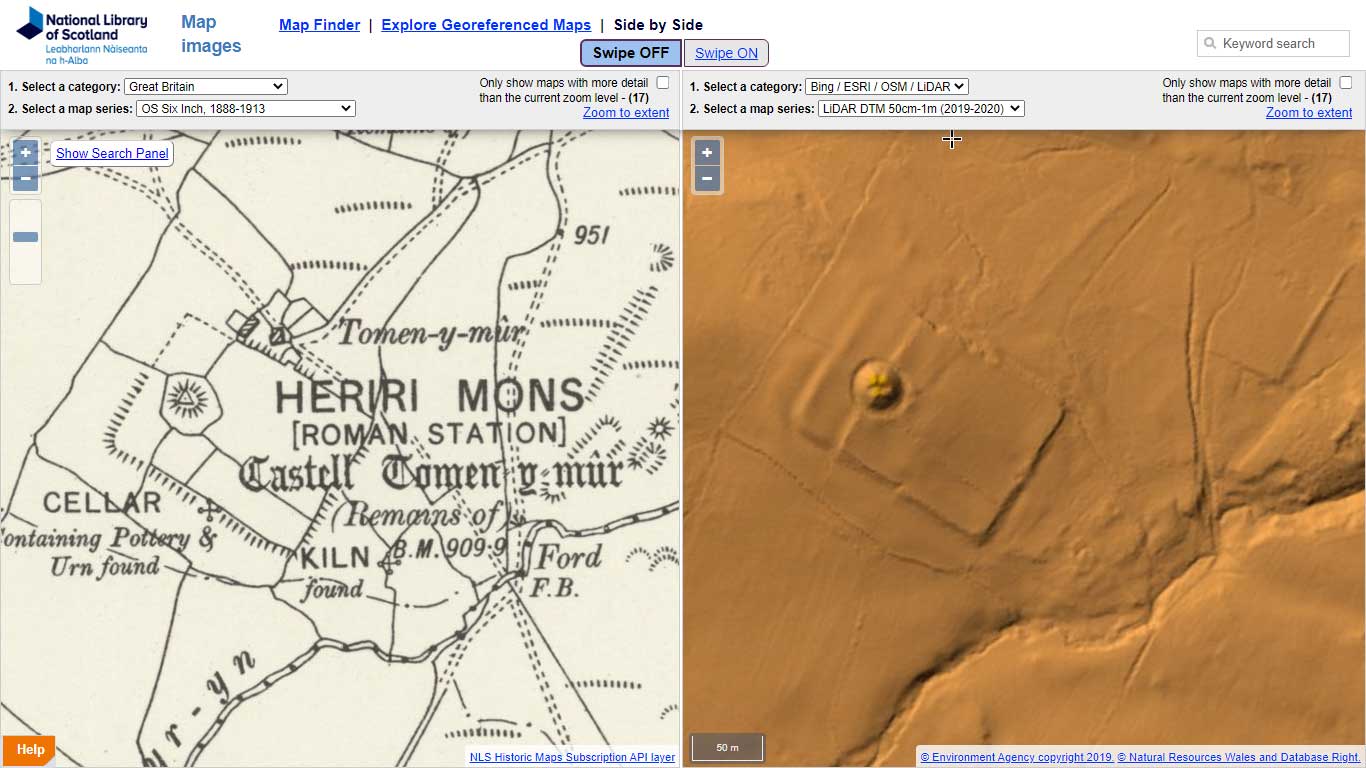
LiDAR is excellent for showing archaeological features like Roman forts and their ramparts, comparing them to historical Ordnance Survey maps that often illustrate these features clearly too:
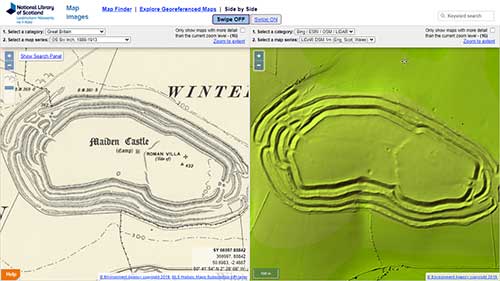
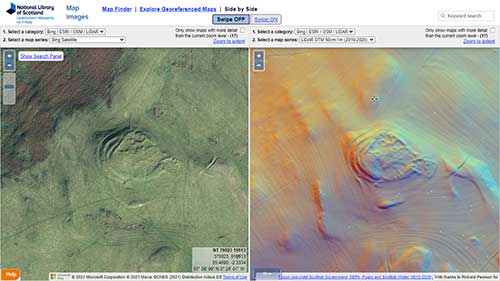
It can also be useful to compare LiDAR to modern satellite imagery for earlier pre-Roman hillforts and related features like cultivation terraces:

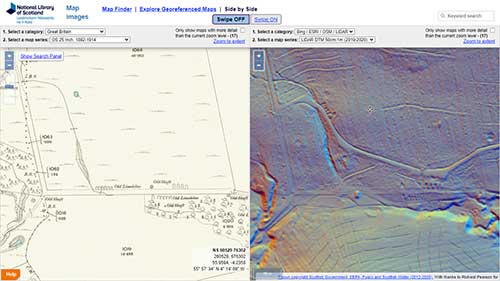
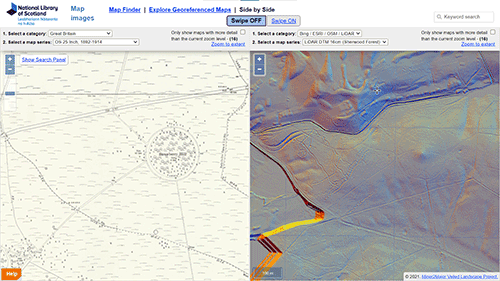
Features like old limekilns that not always clearly marked or labelled on maps, can be confirmed by comparison with LiDAR layers:
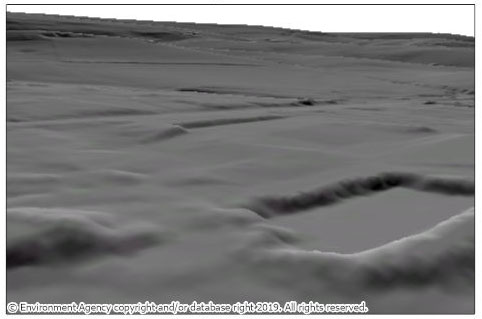
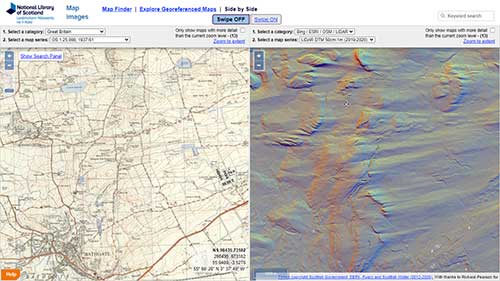
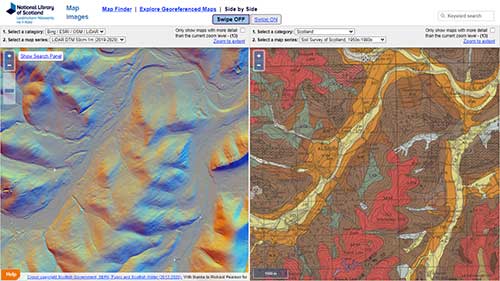
The effects of glaciation on local topography, showing the direction of glacial flow across the landscape can be brought out by LiDAR imagery:
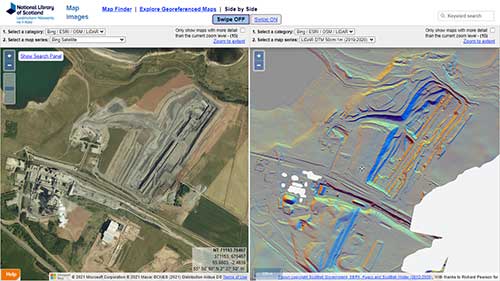
Contemporary landscape features like quarries, railway cuttings, or motorway embankments can be usefully compared alongside modern satellite imagery:
Detailed terrain modelling allows soil scientists to see slope changes and landform breaks which indicate patterns in soil spatial relationships:
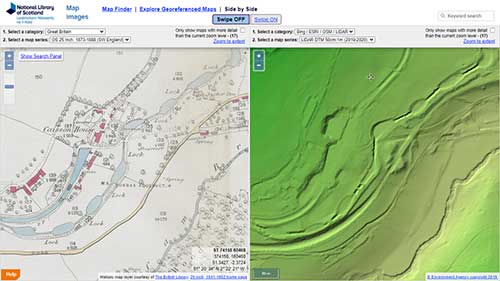
Historic Ordnance Survey maps showing man-made structures such as canals, quarries, and locks can be understood more clearly by comparison with LiDAR imagery:
Sherwood Forest 16cm LiDAR
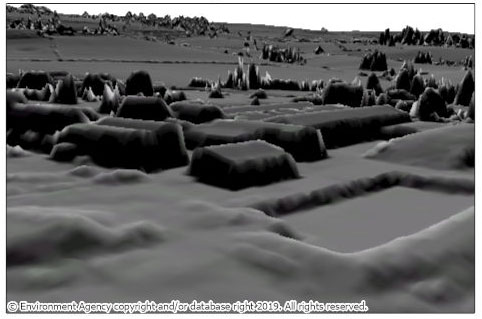
In early 2022, we were pleased to collaborate with the Miner 2 Major Veiled Landscape project to add their 16 cm resolution LiDAR models of the Sherwood Forest, flown in 2021, to our website. This is the highest resolution LiDAR imagery that has been flown of this area (covering some 220 square kilometres) between Retford to the north and Nottingham to the south. It reveals a host of earthwork features beneath the tree cover and on the heathland areas, and much more than can be seen with the previous 1 metre LiDAR flown by the Environment Agency.
In the Strawberry Hill area, several hollow ways survive within the woodland, one of which was a well-used Medieval routeway. There is also a well-preserved set of practice trenches from army training activities from the earlier 20th century. Some of those features can be identified by simple comparison to modern mapping and represent modern pathways through the woodland. Map regression has been used to identify those that are likely modern in origin and those have not been subjected to 'groundtruthing', visiting the site for direct observation.
New (Feb 2024) Updated and expanded DTM layer covering Wales
We are very grateful to Richard Pearson for downloading and reprocessing the Welsh DTM layer. This has now expanded coverage to the whole of Wales at 1 metre resolution, and also enhanced it, using the Relief Visualisation Toolbox (RVT).

Richard's workflow split up the very large TIFF image file (which covers all of Wales) into sections, processed those sections with RVT, and then added an alpha channel to each section to make the areas with no data transparent.
RVT generates more useful visualisations from the same source data, creating 3 channel (Red, Green and Blue) hillshade images which show how the land surface would look if illuminated from 3 different compass directions at the same time (ie. as if we had 3 suns). The red channel 'shines' from 315 degrees, the green from 15 and the blue from 75. This multi-direction hillshade effect has the advantage of picking out minor landscape features more clearly than a single direction hillshade.
View the new LiDAR DTM layer covering Wales in our Georeferenced Maps viewer or our Side by side viewer, or by choosing:
- Select a category: ESRI / OSM / LiDAR, and then
- Select a map series: LiDAR DTM 50cm-1m (Eng, Scot, Wales)
Re-using LiDAR layers
The LiDAR layers we display on this website for England and Wales can be easily downloaded or used as Web Map Services within desktop GIS applications. Please consult the Environment Agency LiDAR datasets (for England), or DataMapWales LiDAR datasets (for Wales) for further details on this.
The Scottish LiDAR DSM / DTM layers can be downloaded or used as Web Map Services within desktop GIS applications through the Scottish Remote Sensing Portal. The Scottish LiDAR DTM layers which we have downloaded and processed using the Relief Visualisation Toolbox are available as Web Map Tile Services at these URLs for each of the Phases:
The Welsh LiDAR DTM layer which has been processed using the Relief Visualisation Toolbox is available as Web Map Tile Services at this URL:
Please consult our Re-using georeferenced maps guides for details of how to bring these LiDAR layers into QGIS or ArcGIS.
If you re-use or re-publish these LiDAR layers, please ensure that you credit and appropriately acknowledge the creators of these specific layers. Please view the Environment Agency LiDAR datasets for England, the Scottish Remote Sensing Portal - datasets for Scotland, or the DataMapWales LiDAR datasets for Wales for specific credits and re-use terms.
Acknowledgements
We are very grateful to Richard Pearson for testing, downloading and processing the Scottish and Welsh LiDAR data to generate these results. We would also like to thank Dr Ed Peveler for much advice and for the original idea of doing this work, and Jeremy Booth for solving the problem of how to download the LiDAR data in bulk. We would also like to thank Tori Bedingfield and colleagues in the Miner 2 Major Veiled Landscape project for sharing their LiDAR data of Sherwood Forest with us.
This page has been put together with helpful advice and contributions from Paul Bishop, Richard Pearson and Ian Roy.
Further information
- Environment Agency LiDAR datasets
- Environment Agency LiDAR data - Technical Note (PDF - 1.6 Mb)
- Historic England LiDAR information
- DataMapWales LiDAR datasets
- Scottish Remote Sensing Portal - datasets
We hope you have found some of this information new and useful. If you have further suggestions or comments, please do contact us at maps@nls.uk.
View our other Research guides.