Bathymetrical Survey of the Fresh-Water Lochs of Scotland, 1897-1909
Soundings
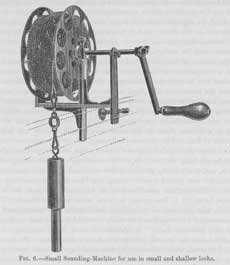
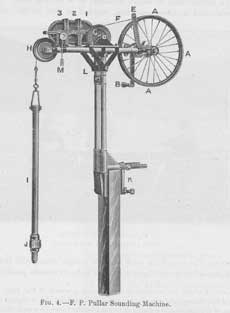
The first attempts at sounding were made with an ordinary hempen hand-line, suitable for shallow lochs, but soon found to be too time-consuming for all deeper waters. A sounding machine (shown left) exhibited by Dr Ule at the 6th International Geographical Congress in London in 1895 was acquired but was found to be untrustworthy. Fred Pullar therefore constructed a better model (shown below), based on bicycle tubing with a drum carrying about 1,000 feet of galvanised wire, the device then fixed to the gunwale of the rowing boat. As this was reeled out into the water, three dials measured feet, tens of feet and hundreds of feet based on the rotating drum. Lake deposits were also collected in brass tubes attached to the lead of the sounding apparatus. The device worked 'admirably and accurately' and was subsequently used by Lieutenant Robert Peary in his Arctic expedition of 1905.
Position of soundings
'At the outset much time was spent in trials as to the best method of determining the positions of the soundings: 1. by the sextant from the boat 2. by signals from the boat to observers on the shore, and; 3. by running lines from two poles placed one behind the other onshore.
'All these methods took a great deal of time, and the fixing of the position was complicated by the drifting of the boat with both wind and water currents'. (Murray & Pullar, 1910, vol. 1, p.14)
In the end, the best approach was found to be the simplest. The oarsman calculated how far he would usually travel in say 10, 15, 20 and 50 strokes, and then rowed in fixed lines across the loch, stopping at appropriate intervals. The soundings were then distributed evenly across the loch, thus equalising any errors. The results were found to be highly accurate for long, narrow lochs, but less correct in wide lakes without islands. However, soundings were usually also taken in several positions between lines, especially where special features were encountered. By the shore, more accurate measurements was performed by stretching tape-lines or cords, several hundred feet in length, from the shore.
Preparation of the Maps
The only assistance from Ordnance Survey to the Bathymetrical Survey was to donate a set of their most recent 6 inch (1:10,560) and one inch (1:63,360) to the mile scale sheets for those areas with lochs being surveyed. For most counties, the base topographic mapping was therefore fairly recently revised by the Ordnance Survey in the 1890s. HMSO also waived copyright in the reproduction of this information by the Bathymetrical Survey.
Once the survey of a loch was completed, soundings were plotted on clean tracings on cloth from the Ordnance Survey maps, and contour lines of depth drawn in at equal intervals. The areas within the consecutive contour lines were measured with a planimeter, and the volume of water and mean depth calculated.
J G Bartholomew & Son, by this time at Duncan Street in Edinburgh, then prepared copies from the cloth tracings, which were carefully revised in the Challenger Office in Edinburgh (the Bathymetrical Survey office). They were then reduced by photography to half-size (i.e. to the scale of 3 inches to the mile) and transferred to lithographic stones for printing. By this time Bartholomew's famous relief shading was widely acclaimed internationally, and given Dr J G Bartholomew's support of science and geographical knowledge, Bartholomew's were an obvious and highly appropriate (as well as local) cartographic publisher to choose.
The original manuscript maps were passed to Ordnance Survey, who in turn passed them to the British Library (Maps.C.21.f.13)
Publication
The maps were published at intervals, with accompanying reports, in the Geographical Journal from 1901 to 1908, with a few also in the Scottish Geographical Magazine. The whole set was brought together as part of the main six-volume publication in 1910 (Murray & Pullar, 1910). There were 223 plates of lochs in total, with approximately half (volumes 3 and 4) showing both surface relief and bathymetry shaded in colour, with those in volumes 5 and 6 showing only bathymetry shaded.
This website shows only the charts from the Survey, but the accompanying volumes also include substantial descriptive, textual information. Volume 1 contains statistical tables of the lochs arranged by length, surface area, maximum depth, mean depth, and volume. It also includes numerous chapters dealing with the results of the survey from a topographical, geological, physical, chemical, and biological points of view.
Volume 2 contains descriptions of the lochs, their general physical nature and properties, within the context of their river basins.
Volumes 3 to 6 show the plates of the loch charts themselves.
![]()
Introduction, facts and background | Soundings and Preparation of the Maps | Biographies