Ordnance Survey Maps - 25 inch England and Wales, 1841-1952
Introduction
Map content, printing, colouring and references
In this section
- Background, coverage, surveying and sheet numbering and parish editions
- Detailed map content, printing, reprinting and colouring
Detailed map content

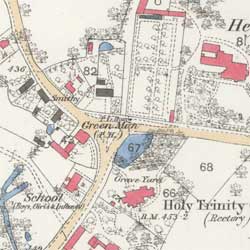
with hand-coloured features
The Ordnance Survey 25 inch to the mile County Series (1841-1952) are a standard topographic authority, depicting practically all human and natural features in the landscape with great accuracy. As for the six inch maps, every road, railway, field, fence, wall, stream and building is shown. There are over 10 different symbols for types of woodland, and uncultivated ground is distinguished into marsh, bog and rough grassland.
The 25 inch scale is four times larger than the six inch, and shows more features in a clearer way:
- Greater detail for all buildings, including divisions between contiguous houses, and even smaller features such as projecting bay windows and steps
- Pavements, garden paths and positions of free standing trees
- Railway tracks and stations in plan form, with many smaller features, such as signal boxes
- Industrial premises, quarries, lime kilns
- Docks, harbours, and quaysides
- All public boundaries, including civil parishes, municipal wards, as well as burgh and county boundaries.
Over time, changes in Ordnance Survey policy and the need to make economies also changed the detailed content on the maps. For example:
- field names were omitted after 1888. That said, in general, only the names of fields which are of particular importance or historical significance (such as open fields, 'ings' or glebe land) were collected and recorded before and after this date. Individual field names were never systematically recorded, but after 1888 there was clearer official guidance to OS surveyors to not publish field names.
- the recording of bay windows, garden paths, gates (except across roads), and hedgerow timber was discontinued after 1892
- public buildings were distinguished from 1897
- the new Ordnance Survey Archaeological Officer, appointed in 1920, led to improved recording of antiquities on Ordnance Survey maps from this time
- new Ministry of Transport road numbers appear from the 1940s
Security deletions
As with other scales of Ordnance Survey maps, various features that were classified or deemed to be 'secret', were omitted from these maps. The definition of these has varied over time and may include features such as airfields, armament depots, explosive works, gas and electricity works, nuclear research or armament premises, oil depots, and prisons.
- Read further information about security deletions based on the OS 'blue-and-black' drawings
Acreages and Books of Reference

The 25 inch maps record acreages of all land parcels. Land parcels were numbered consecutively within each parish, and acreages of fields were recorded in separate Parish Area Books or Books of Reference. Those counties surveyed before 1879 include land use information.
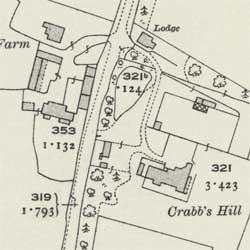
The 25 inch maps record acreages of all land parcels on the map below each parcel number. On the map 1.0018 square inches on the map equals one acre on the ground.
Until 1922, for fields that crossed sheet lines, the usual practice was to give two or more parcel numbers for each sheet. From 1922, for fields that crossed sheet lines, the usual practice was to give the same parcel number on each sheet, and calculate the area to the sheet edge only. Parcel numbers were not changed between editions if at all possible.
From 1889 until ca. 1907, built up areas for which were too detailed for individual land parcels were edged by a yellow band, and the acreage shown for this wider area. From 1897 to 1909, stipple bands were used. Smaller land parcels were sometimes grouped together through the 'S' (or brace symbol) crossing over parcel boundaries, with the acreage given for the multiple land parcels.
Revision dates
The whole country was initially surveyed between 1842 and 1893.
Following the recommendations of the Ordnance Survey Dorington Committee in 1893, all counties were to be revised every twenty years. This was largely followed in practice until the First World War. From 1892 to 1907 all English and Welsh counties were revised once, and a further fourteen were revised again up to 1914.
However, following the First World War, economies forced the suspension of such regular revision for mountainous and sparsely-populated areas. Officially, these counties that were previously on a twenty-year revision cycle were moved to a forty-year revision cycle. This particularly affected more upland and remote areas, where some rural mapping in practice was often not revised until the 1960s. For these mountainous and sparsely-populated rural areas, there is therefore only one 25 inch revision of maps from the 1890s to the 1960s.
In contrast, urban districts and those areas undergoing considerable change were revised more regularly. Larger urban areas and towns often have three or more revisions between the 1890s and the 1940s.
Although the official policy was to publish new National Grid sheets from 1945, updated County Series maps continued to be issued for selected rural areas until the 1950s when they were eventually overhauled as part of the new National Grid survey.
- View list of English and Welsh counties, with their survey and publication and changes of meridian.
Printing
Unlike the six inch and one inch maps that were engraved on copper plates, the 25 inch maps were produced by zincography.
Zincography was significantly cheaper, corrections were easier to make, and it was suited to the bold lines and large fonts of the 25 inch scale. The process involved drafting a manuscript plan with litho transfer ink on tracing paper, and the impression transferred to a prepared zinc plate. The zinc plate was then etched with nut galls and phosphoric acid, cleaned, and litho printing ink applied for printing impressions using a hand press.
Lithographic stones had been used at Ordnance Survey from the 1840s, but zinc plates increasingly replaced them from the 1850s. Zinc plates had the advantages of being lighter, and impressions from other copper or zinc plates could be easily copied onto them through electrotyping.
From the 1880s, photo-zincography allowed the automatic reduction of 25 inch maps to the six inch scale through photographic methods, allowing further economies in map production. For this reason, the 25 inch maps developed a bold style and large lettering suitable for reduction to a quarter of the size.
Reprinting
As the 25 inch maps were usually printed through zincography, the original manuscript "fair copy" was kept on paper, and if new copies were needed, it involved retracing it again on a zinc plate for printing. Whilst this did not usually alter the landscape information recorded by the original survey, it did alter the style and presentation of this survey information. The following summary details below are taken from Oliver & Bishop (2016), who deal with the subject in more useful depth.
The presentation of acreages, altitudes and minor detail (such as paths in gardens, and rails under roofed areas) changed between these various states and reprints.
Survey, etc, date: From about 1871 this was included in a publication statement in the bottom centre margin. By 1880 it was in a separate note placed bottom left. This was occasionally supplemented by a note of revision or by a note concerning additional railway information. It should be noted that up to 1888 the date of ‘survey’ was actually that when the fair plan was certified as fit for publication, and that this may be a year or so later than the latest visit to the ground.
Publication date: This was only routinely included on zincographed map sheets from about 1879 onwards. Up to 1887 there was a two-line note, with ‘Zincographed and published’ in italic and the publication date in sans-serif ‘Egyptian’ on a separate line below.
Boundary legend: An explanation of ‘Characteristics and symbols for boundaries &c’ was added to some reprints from the early 1890s onwards. It was produced by transferring from a copper engraved original.
Edition heading: A heading, approximately top centre, in the style ‘FIRST EDITION 18__’ was introduced in about 1894 or 1895, probably at the same time as the publication of the first 1:2500 ‘Second Edition’ sheets.
For further detail on this, see:
R. Oliver & P. Bishop, 'Re-drawing of OS First Edition 1:2500 sheets for a later First Edition printing', Sheetlines 106 (August 2016), pp 43-49. View online.
Colouring
Some of the first edition sheets were coloured, using:
- Blue for water features
- Burnt sienna for roads
- Carmine for buildings made of brick or stone
- Grey for buildings made of wood or iron.
The colour was applied by hand, initially by boys paid on a piece work basis, and later by women. From the 1890s, the only colour added was blue for water features.
- View the colours and symbols on the maps and their meaning
References
Close, C (1926, reprinted 1969). The early years of the Ordnance Survey. Newton Abbot: David & Charles.
Delano-Smith, C, and Kain, R J P (1999). English maps – a history. Toronto: University of Toronto Press.
James, H (1873). Account of the field surveying and the preparation of the manuscript plans of the Ordnance Survey. London: HMSO.
James, H (revised by Duncan A Johnston) (1902). Account of the methods and processes adopted for the production of the maps of the Ordnance Survey of the United Kingdom … 2nd edition. London: HMSO.
Harley, J B (1979). The Ordnance Survey and land-use mapping. Historical Geography Research Series of the Institute of British Geographers Number 2. Norwich: Geoabstracts.
Oliver, R (2013). Ordnance Survey maps: a concise guide for historians, 3rd ed. London: Charles Close Society.
R. Oliver & P. Bishop (2016) 'Re-drawing of OS First Edition 1:2500 sheets for a later First Edition printing', Sheetlines 106, pp 43-49. View online.
Owen, T and Pilbeam, E (1992). Ordnance Survey: map makers to Britain since 1791. Southampton: Ordnance Survey; London: HMSO.
Sankey, H R (reprinted 1995). The maps of the Ordnance Survey: a mid-Victorian view, (ed. by Ian Mumford). London: Charles Close.
Seymour, W A (ed.) (1980). A history of the Ordnance Survey. Folkestone, Kent: Dawson.
Wilson, C (1891). Methods and processes of the Ordnance Survey, Scottish Geographical Magazine 7, 248-59.
Winterbotham, H St J L (1934). The national plans (the ten-foot, five-foot, twenty-five-inch and six-inch scales). OS Professional Papers, New series, 16. London: HMSO.
 Previous: Page 1 of 2
