Ordnance Survey Maps - 25 inch 2nd and later editions, Scotland, 1892-1949
Introduction
In this section
- Characteristics, content, acreages and geographic coverage
- Projections, meridians, revision, and sheet numbering
Projections
Ordnance Survey County Series maps were based on the Cassini Projection, a transverse cylindrical projection, where a central meridian of longitude forms the point of origin and the line of zero distortion (where all distances are true to scale). Distances along the great circles of the earth that meet this central meridian at right angles are also plotted true to scale, but all (North-South) distances parallel to the central meridian are increasingly too great on the map, the farther they are away from the central meridian. It follows that the Cassini Projection is best suited for areas with a relatively narrow extent in longitude, perhaps no more than three or four counties width in the case of the large-scale maps.
Following the recommendations of the Ordnance Survey Davidson Committee in 1938, all large-scale maps were recast on a new national Transverse Mercator projection with metric sheet lines, subsequently known as the National Grid. From 1945 the new National Grid kilometre square lines were usually overprinted onto the County Series maps. The main part of the Retriangulation was completed in 1951 and the National Grid became adopted for all Ordnance Survey maps.
Meridians

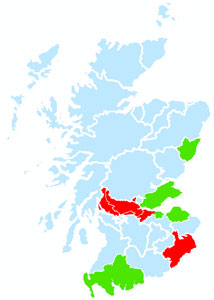
1890s in green, and 1914-1919 in red.
On the County Series maps, most Scottish counties had their own separate county point of origin, usually the nearest triangulation station to the North-South centre line of the county. Sheets were laid out from North-West to South-East in separate county sequences. It also follows that due to the separate origins and the nature of the Cassini projection, areas at the edges of counties do not fit precisely with their neighbouring county sheets, especially at their East-West extents.
From the 1890s, the counties originally surveyed only at the six-inch scale (Edinburghshire, Fife, Haddingtonshire, Kinross-shire, Kirkcudbrightshire, and Wigtonshire) along with Kincardine-shire and the detached portion of Dunbartonshire were revised using new county meridians. In addition, from 1914, pressures to reduce the number of county meridians led to four Scottish county meridians being merged: Dunbartonshire, Linlithgowshire, Roxburghshire, and Stirlingshire. In all cases these counties had new sheet lines for the County Series maps, with their sheet numbers often prefixed by the letter 'N'.
- View list of Scottish counties, with their changes of meridian, and dates of survey and publication.
Revision dates

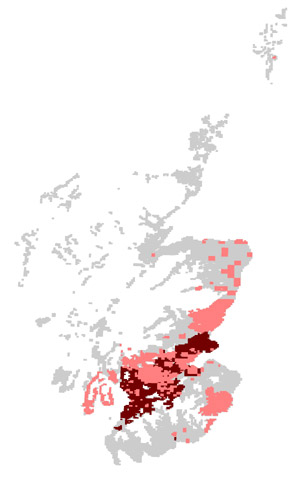
after 1907 (in pink) and 1913 (in red).
Following the recommendations of the Ordnance Survey Dorington Committee in 1893, all counties were to be revised every twenty years. This was largely followed in practice until the First World War. From 1892 to 1907 all Scottish counties were revised once, and a further fourteen were revised again up to 1914. Three-quarters of all the 2nd and later edition 25 inch maps were published between 1892 and 1907.
However, following the First World War, economies forced the suspension of such regular revision for mountainous and sparsely-populated areas. Officially, these counties that were previously on a twenty-year revision cycle were moved to a forty-year revision cycle. This particularly affected most of the Highlands and Islands, where rural mapping in practice was often not revised until the 1970s. For these mountainous and sparsely-populated rural areas, there is therefore only one 25 inch revision of maps from the 1890s to the 1960s.
In contrast, urban districts and those areas undergoing considerable change were revised more regularly. The larger urban areas of Edinburgh, Dundee, Glasgow, and several towns in the Central Belt often have three or more revisions between the 1890s and the 1940s. However, only 644 sheets (4% of the total) date after 1930.
Although the official policy was to publish new National Grid sheets from 1945, updated County Series maps continued to be issued for selected parts of the Highlands until the 1960s when they were eventually overhauled as part of the new National Grid survey. We show those on this website that are out-of-copyright, published over 50 years ago.
The 25 inch series has continued through to the present day, with the six inch and one inch maps derived or reduced from the larger scale. The 25 inch or 1:2,500 still forms the most detailed mapping of rural areas in modern Ordnance Survey digital data.
- View list of Scottish counties, with their changes of meridian, and dates of survey and publication.
Sheet numbering and size
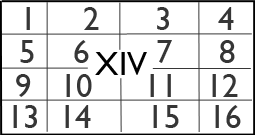
Before the Second World War, all detailed Ordnance Survey maps were based on local county projections and meridians, and all sheets carried the relevant county name. (Read more about OS county projections). The 25 inch sheets were laid down as a set of 16 sub-sheets within each parent six inch sheet. Their two sheet numbers therefore reflect, first, the relevant six inch sheet (usually a Roman numeral), and second, the relevant sub-sheet, 1-16. Typical 25 inch sheet references take the form:

- Roxburghshire XXV.2
- Selkirkshire XIV.10
Each 25 inch sheet covers a distance on the ground of 1.5 miles (west-east) by 1 mile (north-south). Each sheet measures 96.6 cm (38.016 inches) by 64.4 cm (25.344 inches) within the map neat line. The true scale is 25.344 inches to the mile, so being a metric 1:2,500 scale map.

