Ordnance Survey Maps - Six-inch England and Wales, 1842-1952
Triangulation, projection, meridians and sheet lines

View larger image
Triangulation had been employed by European map-makers intermittently from the sixteenth century as a means of working out a network of distances from measuring a single base line and the related angles of set of triangles. Ordnance Survey's achievements in triangulation were to use the latest instruments and greater manpower to measure more accurate angles and base line distances than before in order between 1791 and 1822, largely under William Mudge, to position a network of triangulation stations over the whole of Britain other than North-West Scotland. This is often termed the Primary Triangulation.
In the following decades, work on geodesy progressed on several fronts, and much of the earlier work was checked and revised in an ongoing quest for greater accuracy. The British triangulation was extended under Thomas Colby to include Ireland and NW Scotland. The Greenwich-Paris connection by trigonometry was re-measured in 1821-1823, new chronometers for better determination of longitude were used under the direction of the Astronomer Royal George Airy in the 1840s, latitudes were more accurately determined with improved zenith sectors, and the shape of the earth or spheroid was extensively researched. In the 1840s the triangulation was improved and strengthened under William Yolland. His Diagram of the Principal Triangulation published about 1852 marks a significant transition. (For further details on this subject and related Scottish triangulation work, see David L. Walker's articles in Sheetlines).
In 1854 the formidable task of adjusting the triangulation to form a consistent national network was passed on to Alexander Ross Clarke (1828-1914). Unencumbered by other duties, Clarke compiled the exhaustive report attributed to Henry James in 1858. To reduce the number of calculations, he excluded about a quarter of the stations. Hence the diagram of the principal triangulation originally published in 1858 (and summarised for the Royal Society in 1856 and in Plate 11 of Seymour) differs significantly.
In the early 1860s, the triangulations of England, France and Belgium were connected, and further international collaboration with Russia and Prussia allowed the 52 degree North parallel, from the West of Ireland to the Urals, to be accurately measured. Clarke headed the Trigonometrical and Levelling Branch until the early 1880s, and the shape of his central network was retained for the Retriangulation in 1936.
Projections
Ordnance Survey County Series maps were based on the Cassini Projection, a transverse cylindrical projection, where a central meridian of longitude forms the point of origin and the line of zero distortion (where all distances are true to scale). Distances along the great circles of the earth that meet this central meridian at right angles are also plotted true to scale, but all (North-South) distances parallel to the central meridian are increasingly too great on the map, the farther they are away from the central meridian. It follows that the Cassini Projection is best suited for areas with a relatively narrow extent in longitude, perhaps no more than three or four counties width in the case of the large-scale maps.
Following the recommendations of the Ordnance Survey Davidson Committee in 1938, all large-scale maps were recast on a new national Transverse Mercator projection with metric sheet lines, subsequently known as the National Grid. From 1945 the new National Grid kilometre square lines were usually overprinted onto the County Series maps. The main part of the Retriangulation was completed in 1951 and the National Grid became adopted for all Ordnance Survey maps.
Meridians
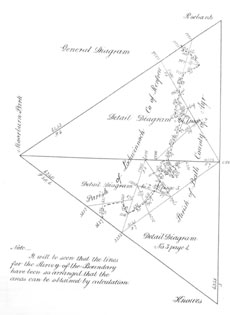
On the County Series maps, although some counties had their own separate county point of origin (usually the nearest triangulation station to the North-South centre line of the county), most counties shared a meridian. Due to the nature of the Cassini projection, counties with separate origins do not fit precisely with their neighbouring county sheets, especially at their East-West extents. Those counties sharing a common origin - for example, 14 counties in central England with the Dunnose origin, or 11 counties in or bordering on Wales sharing the Llangeinor origin - have regular adjoining sheetlines and common sheets at county borders. These sheets usually carry references under both counties, although on our website, we have tended to record the sheet reference under the first named county only. Please note that our recording of dates for sheets at county boundaries is also usually for the first named county only: the marginal information in the lower left of the sheet contains fuller information on dates of survey/revision of neighbouring counties for the whole sheet.
Unlike in Scotland, where 11 counties changed meridians and sheet lines over the course of the County Series, only two counties in England and Wales changed meridians over time: Essex and Northumberland after 1912-13. These two counties had new sheet lines for the County Series maps, with their sheet numbers often prefixed by the letter 'N' after 1912-13.
Within each county, sheets were laid out from North-West to South-East in separate county sequences.
- View list of English and Welsh counties, with their dates of survey, publication and changes of meridian.
Full-sheet and quarter-sheet extents

View larger image
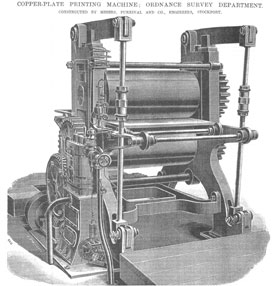
From the 1840s to the early 1880s, all the six-inch maps were engraved and printed from special hammered copper, 1/10th inch thick and measuring 26.5 by 38.5 inches in extent. ( Read more about OS engraved six-inch map printing ). From 1882 onwards, the usual practice was to print the maps as quarter-sheets by photo- or helio-zincography. Zincography was significantly cheaper than copper plate engraving, and corrections were easier to make, but it was criticised for producing less clear maps. Photo- or helio-zincography also allowed the automatic reduction of 25 inch maps to the six-inch scale through photographic methods, allowing further economies in map production. The six-inch full sheets were resumed briefly between 1920-24, but were quickly discontinued, following protests from users.
The Ordnance Survey six-inch maps were generally uncoloured, but blue wash was used for water features in the 1890s, and red used for contours from ca. 1912.
All Ordnance Survey six-inch map sheets carried their relevant county name followed by the specific sheet number. Quarter-sheets, dividing the full-sheet area into North-West, North-East, South-West, and South-East quarters, were the more usual practice.
- Each full-sheet six-inch map covers an area of four by six miles on the ground, with a map sheet extent of 24 inches in height by 36 inches in width. A typical sheet reference takes the form: Lancashire Sheet XII
- Each quarter sheet map covers an area of two by three miles on the ground, with a map extent of 12 inches in height by 18 inches in width. A typical sheet reference takes the form: Lancashire Sheet XII.NW
References
Andrews, J H (1975). A paper landscape: the Ordnance Survey in nineteenth-century Ireland. Oxford: Clarendon Press.
Close, C (1926, reprinted 1969). The early years of the Ordnance Survey. Newton Abbot: David & Charles.
Delano-Smith, C, and Kain, R J P (1999). English maps – a history. Toronto: University of Toronto Press.
James, H (1873). Account of the field surveying and the preparation of the manuscript plans of the Ordnance Survey. London: HMSO.
James, H (revised by Duncan A Johnston) (1902). Account of the methods and processes adopted for the production of the maps of the Ordnance Survey of the United Kingdom … 2nd edition. London: HMSO.
Harley, J B (1979). The Ordnance Survey and land-use mapping. Historical Geography Research Series of the Institute of British Geographers Number 2. Norwich: Geoabstracts.
Oliver, R (2013). Ordnance Survey maps: a concise guide for historians, 3rd ed. London: Charles Close Society.
Owen, T and Pilbeam, E (1992). Ordnance Survey: map makers to Britain since 1791. Southampton: Ordnance Survey; London: HMSO.
Portlock, J E (1869). Memoir of the life of Major-General Colby. London: Seeley, Jackson, and Halliday .
Sankey, H R (reprinted 1995). The maps of the Ordnance Survey: a mid-Victorian view, (ed. by Ian Mumford). London: Charles Close.
Seymour, W A (ed.) (1980). A history of the Ordnance Survey. Folkestone, Kent: Dawson.
Wilson, C (1891). Methods and processes of the Ordnance Survey, Scottish Geographical Magazine 7, 248-59.
Winterbotham, H St J L (1934). The national plans (the ten-foot, five-foot, twenty-five-inch and six-inch scales). OS Professional Papers, New series, 16. London: HMSO.
 Previous: Page 1 of 2
