Ordnance Survey Maps - 25 inch England and Wales, 1841-1952
Introduction
The Ordnance Survey 25 inch to the mile County Series (1841-1952) is immensely valuable for local history. It is the most detailed Ordnance Survey mapping for most parts of England and Wales. Only urban areas with a population of over 4,000 people were mapped in more detail.
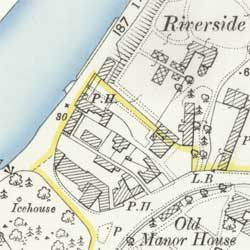
The maps allow practically every feature in the landscape to be shown. They provide good detail of all buildings, streets, railways, industrial premises, parkland, farms, woodland, and rivers. Their bold style and informative symbols and abbreviations allow easy interpretation for a wide range of uses.
Ordnance Survey 25 inch to the mile (or 1:2,500) County Series home page
In this section
- Background, coverage, surveying, sheet numbering and parish editions
- Map content, printing, reprinting and colouring
Background
Initial surveying of England and Wales by Ordnance Survey was carried out at the less detailed scales of one-inch and six-inch to the mile. The six-inch had been the scale used in Ireland from the 1820s, and continued in northern England and Scotland in the 1840s. However, there were protracted debates as to whether this was the correct basic scale (i.e. the largest practical scale for surveying). The six inch scale allowed more rapid progress to be made, and was often satisfactory for moorland and uncultivated areas, but the 25 inch scale had a number of advantages in more populated regions.
The 25 inch maps were more useful for:

- Land valuation / registration purposes and conveyancing - old title deeds often refer to specific numbered land parcels on these maps
- Railway developments - railway tracks and stations are shown in plan form, with many smaller features, such as signal boxes
- Agricultural development - changes in land use and farm buildings, as well as quarries and lime kilns
- Urban change - greater detail for all buildings, including divisions between contiguous houses, and industrial premises
- Water supply and sewerage, mill lades, as well as docks, harbours and quaysides
- All public boundaries, including civil parishes, municipal wards, as well as burgh and county boundaries.
The Battle of the Scales, as it became known, was a protracted debate during the 1850s, over whether the six-inch or 25 inch should be the basic scale. In 1855, the 25 inch was officially authorised as the basic scale for all cultivated rural areas. In 1857, the 25 inch series was temporarily discontinued, but it was re-authorised again in 1858. Only mountainous or moorland areas, particularly in parts of northern England, Wales and the south-west were not mapped at the 25 inch scale.
The 25 inch series has continued through to the present day, with the six inch and one inch maps derived or reduced from the larger scale. The 25 inch or 1:2,500 still forms the most detailed mapping of rural areas in modern Ordnance Survey digital data.
Comprehensiveness
We have scanned all our holdings of these OS 25 inch maps. However, our holdings are incomplete, and the principal exclusions are:
- earliest copies of sheets, published before 1911. Following the Copyright Act of 1911, the Advocates' Library / NLS received OS map publications more comprehensively, but before this time, our holdings are much more scattered, primarily received by donation. The other legal deposit libraries may hold earlier editions of these maps not held by NLS.
- 'Land Valuation' maps, produced ca. 1911-12, using OS 25 inch maps with manuscript annotations to show land-ownership. These maps are held in The National Archives (for England and Wales) and the National Records of Scotland (for Scotland). A few sheets were also published with a heading the style 'Special Edition 1912'.
Surveying and levelling
Survey work was based on triangulation by teams of eight to 12 men on the ground, using standard chains and theodolites. Levelling work created a set of accurate heights, either on permanent features (benchmarks) or as spot heights (e.g. road centres). The 25 inch maps show benchmarks and spot heights, but not contour lines, which appear on six inch maps and smaller scale maps.
Projections
Ordnance Survey County Series maps were based on the Cassini Projection, a transverse cylindrical projection, where a central meridian of longitude forms the point of origin and the line of zero distortion (where all distances are true to scale). Distances along the great circles of the earth that meet this central meridian at right angles are also plotted true to scale, but all (North-South) distances parallel to the central meridian are increasingly too great on the map, the farther they are away from the central meridian. It follows that the Cassini Projection is best suited for areas with a relatively narrow extent in longitude, perhaps no more than three or four counties width in the case of the large-scale maps.
Meridians
On the County Series maps, although some counties had their own separate county point of origin (usually the nearest triangulation station to the North-South centre line of the county), most counties shared a meridian. Due to the nature of the Cassini projection, counties with separate origins do not fit precisely with their neighbouring county sheets, especially at their East-West extents. Those counties sharing a common origin - for example, 14 counties in central England with the Dunnose origin, or 11 counties in or bordering on Wales sharing the Llangeinor origin - have regular adjoining sheetlines and common sheets at county borders. These sheets usually carry references under both counties, although on our website, we have tended to record the sheet reference under the first named county only. Please note that our recording of dates for sheets at county boundaries is also usually for the first named county only: the marginal information in the lower left of the sheet contains fuller information on dates of survey/revision of neighbouring counties for the whole sheet.
Unlike in Scotland, where 11 counties changed meridians and sheet lines over the course of the County Series, only two counties in England and Wales changed meridians over time: Essex and Northumberland after 1912-13. These two counties had new sheet lines for the County Series maps, with their sheet numbers often prefixed by the letter 'N' after 1912-13.
Within each county, sheets were laid out from North-West to South-East in separate county sequences.
- View list of English and Welsh counties, with their survey and publication and changes of meridian.
Sheets, numbering and parishes
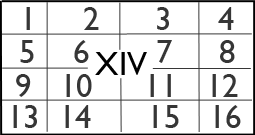
Before the Second World War, all detailed Ordnance Survey maps were based on local county projections and meridians, and all sheets carried the relevant county name. (Read more about OS county projections). The 25 inch sheets were laid down as a set of 16 sub-sheets within each parent six inch sheet. Their two sheet numbers therefore reflect, first, the relevant six inch sheet (usually a Roman numeral), and second, the relevant sub-sheet, 1-16. Typical 25 inch sheet references take the form:

- Kent XXV.2
- Northamptonshire XIV.10
Each 25 inch sheet covers a distance on the ground of 1.5 miles (west-east) by 1 mile (north-south). Each sheet measures 96.6 cm (38.016 inches) by 64.4 cm (25.344 inches) within the map neat line. The true scale is 25.344 inches to the mile, so being a metric 1:2,500 scale map.
Parish editions
Before the 1870s, sheets were published as separate parish sets, so that for sheets containing two or three parishes, there were two or three separate parish sheets published for that map sheet area. Anywhere beyond the specific parish appears blank, and it may be necessary to consult the adjacent parishes to see the mapping for these blank areas.
During the 1870s, these separate parish sheets were replaced by combined parish sheets, completely filling the map sheet area in one published sheet.
 Next: Page 2 of 2
